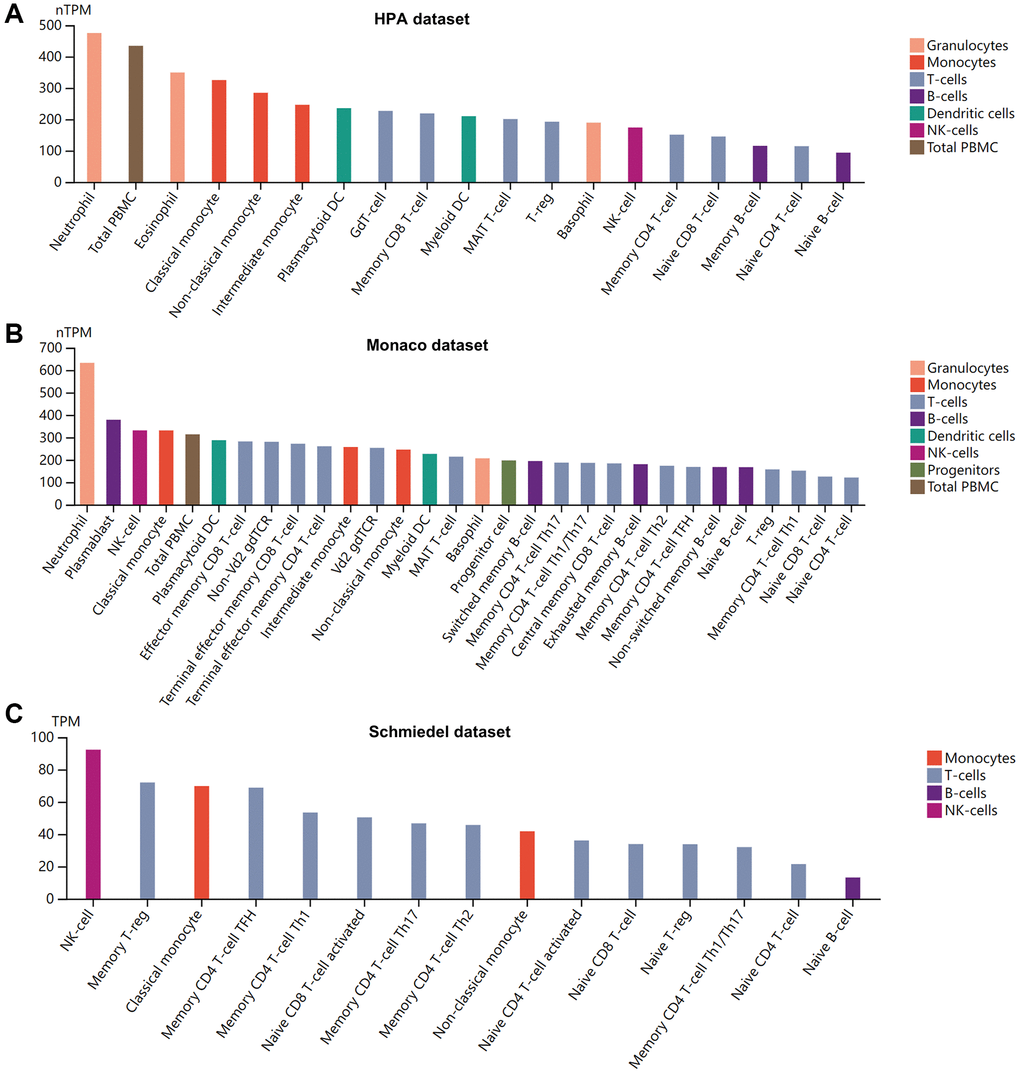
Figure 3.Pattern of BSG expression in human blood cells. (A) HPA dataset. (B) Monaco dataset. (C) Schmiedel dataset. X: blood cell types, Y: BSG expression value in transcripts per million (TPM).
Figure 3 — A comprehensive investigation on the receptor BSG expression reveals the potential risk of healthy individuals and cancer patients to 2019-nCoV infection | Aging