Submit an Article
Navigate
Home
Editorial Board
Editorial Policies
Current Volume
Archive
Scientific Integrity
Publication Ethics Statements
Interviews with Outstanding Authors
Newsroom
Sponsored Conferences
Podcast
Contact
Special Collections
Submit an Article
Online ISSN: 1945-4589
Research Paper
|
Volume 16, Issue 5
|
pp. 4920–4942
Establishment of an immunogenic cell death-related model for prognostic prediction and identification of therapeutic targets in endometrial carcinoma
Back to article
Figure 8
(8 of 10)
−
100%
+
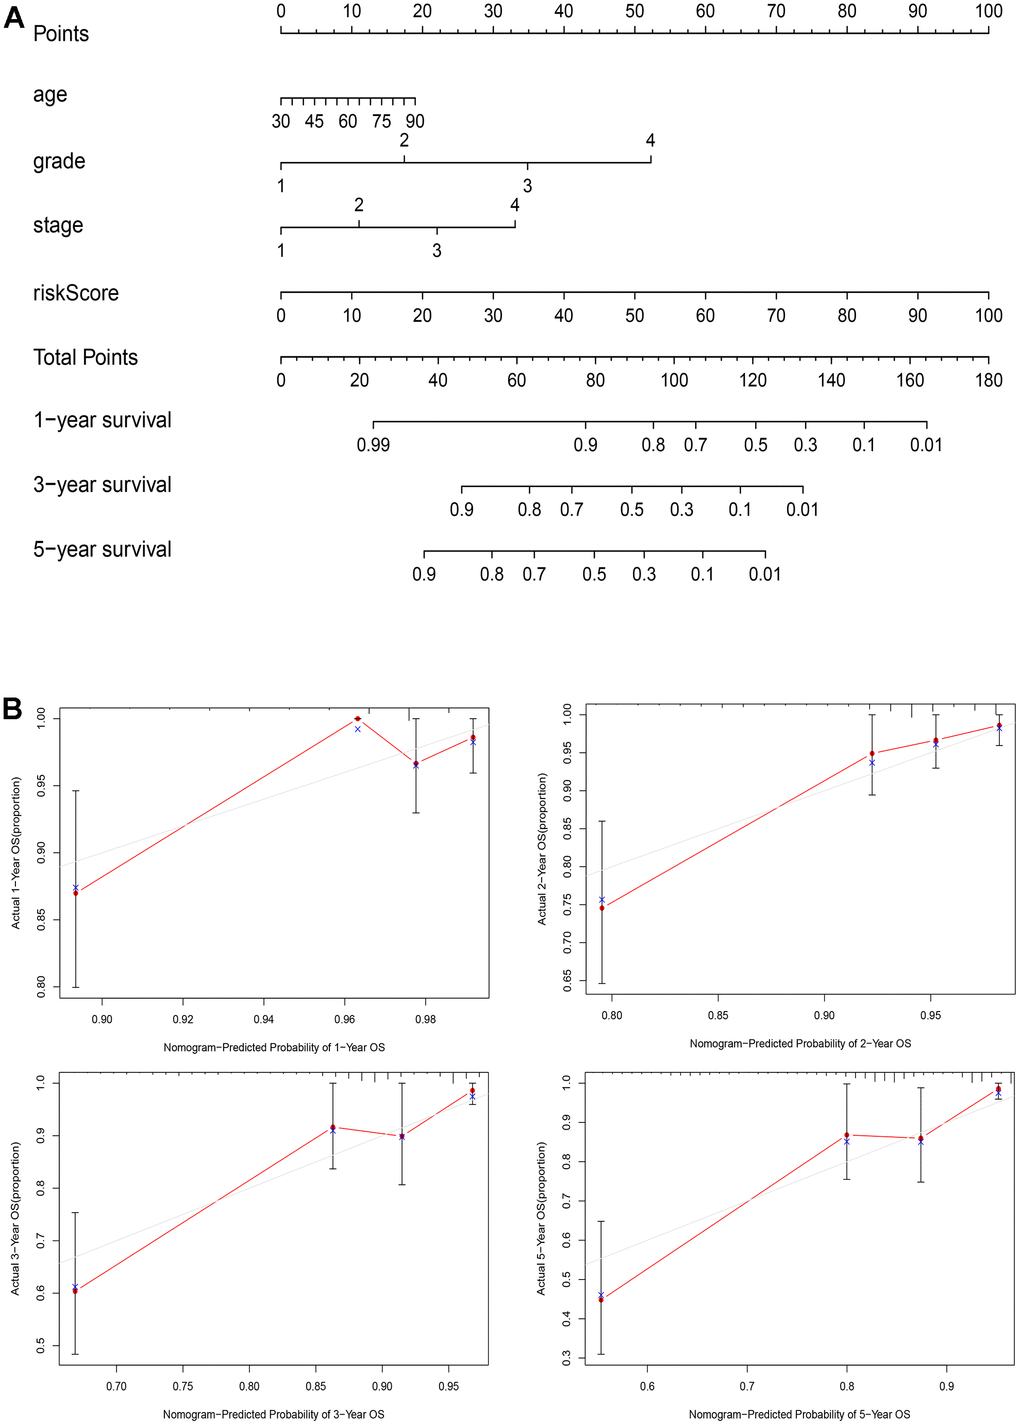
Figure 8.
A nomogram for clinical application.
(
A
) The nomogram based on age, grade, stage, and risk score for providing prognosis of patients with EC; (
B
) Calibration plots for the 1-year, 2-year, 3-year, and 5-year OS nomogram model.