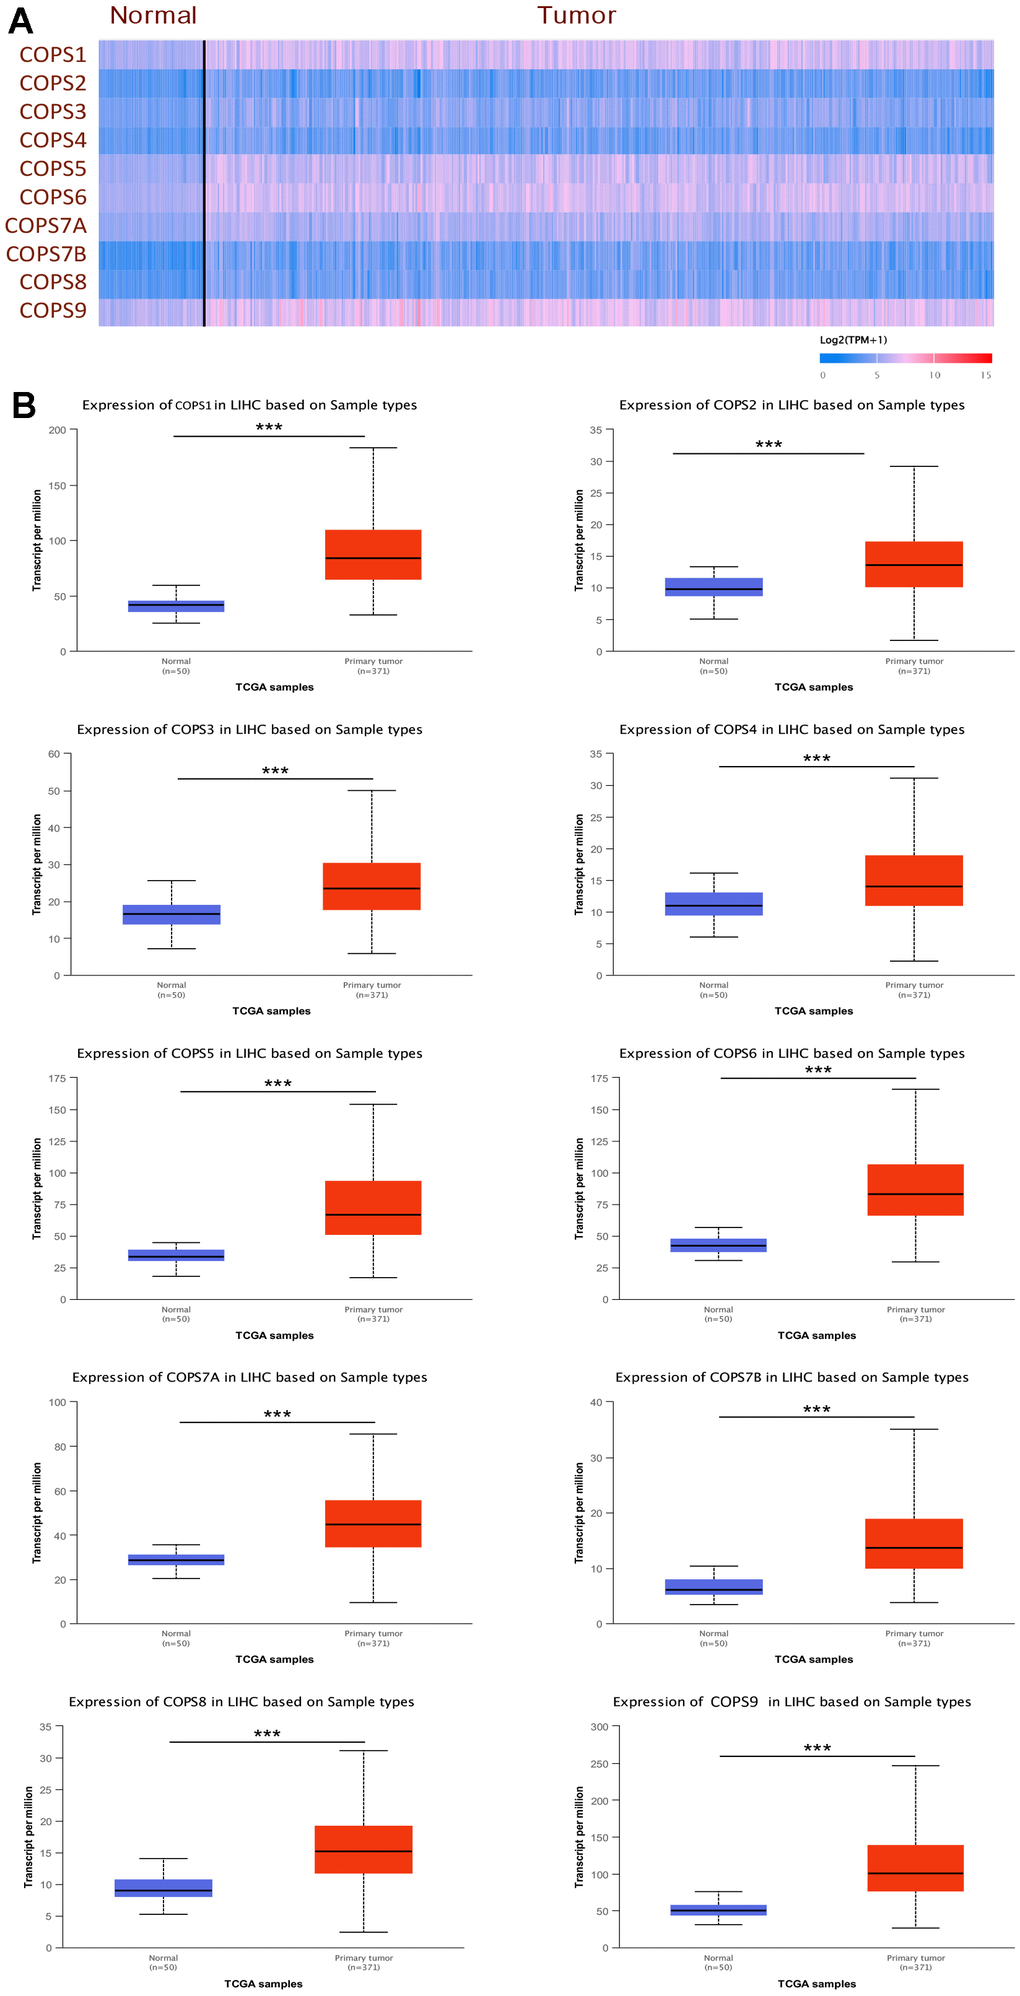
Figure 2.Elevated expression levels of COPS subunit mRNAs in HCC tissue (from the UALCAN database). (A) Heatmap showing the differential expression levels of COPS subunit mRNAs between HCC and normal liver tissues. (B) Direct comparison of COPS subunit mRNAs between HCC and normal liver tissues. ***p < 0.001.