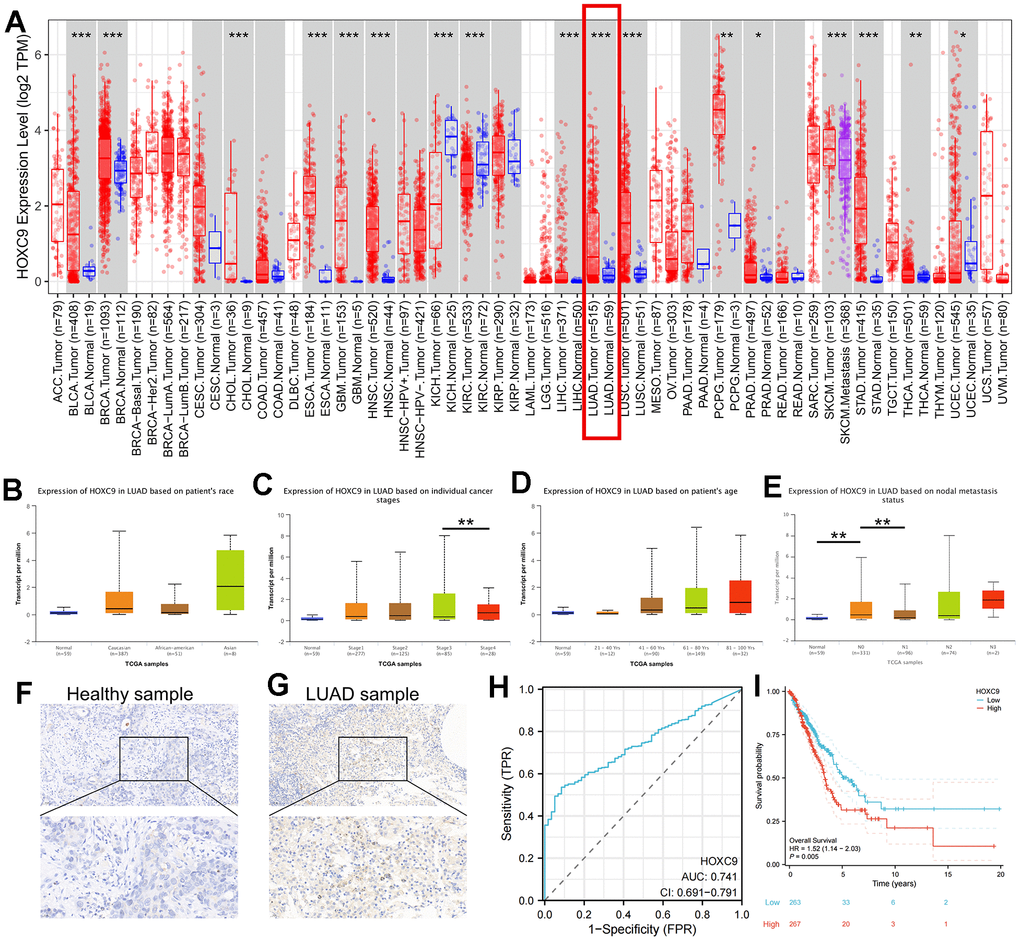
Figure 1.Analyses of HOXC9 expression and the diagnostic and prognostic value in LUAD. (A) The expression distribution of HOXC9 in tumor tissues and normal tissues with TIMER2, respectively; (B–E) The correlation between HOXC9 expression and clinical variables of LUAD; (F) The HOXC9 protein level in adjacent healthy tissue; (G) and in the tumor tissue; (H) The diagnostic value of HOXC9 in LUAD; (I) The OS analysis of HOXC9 in LUAD patients. (*, P<0.05; **, P<0.01; ***, P<0.001).