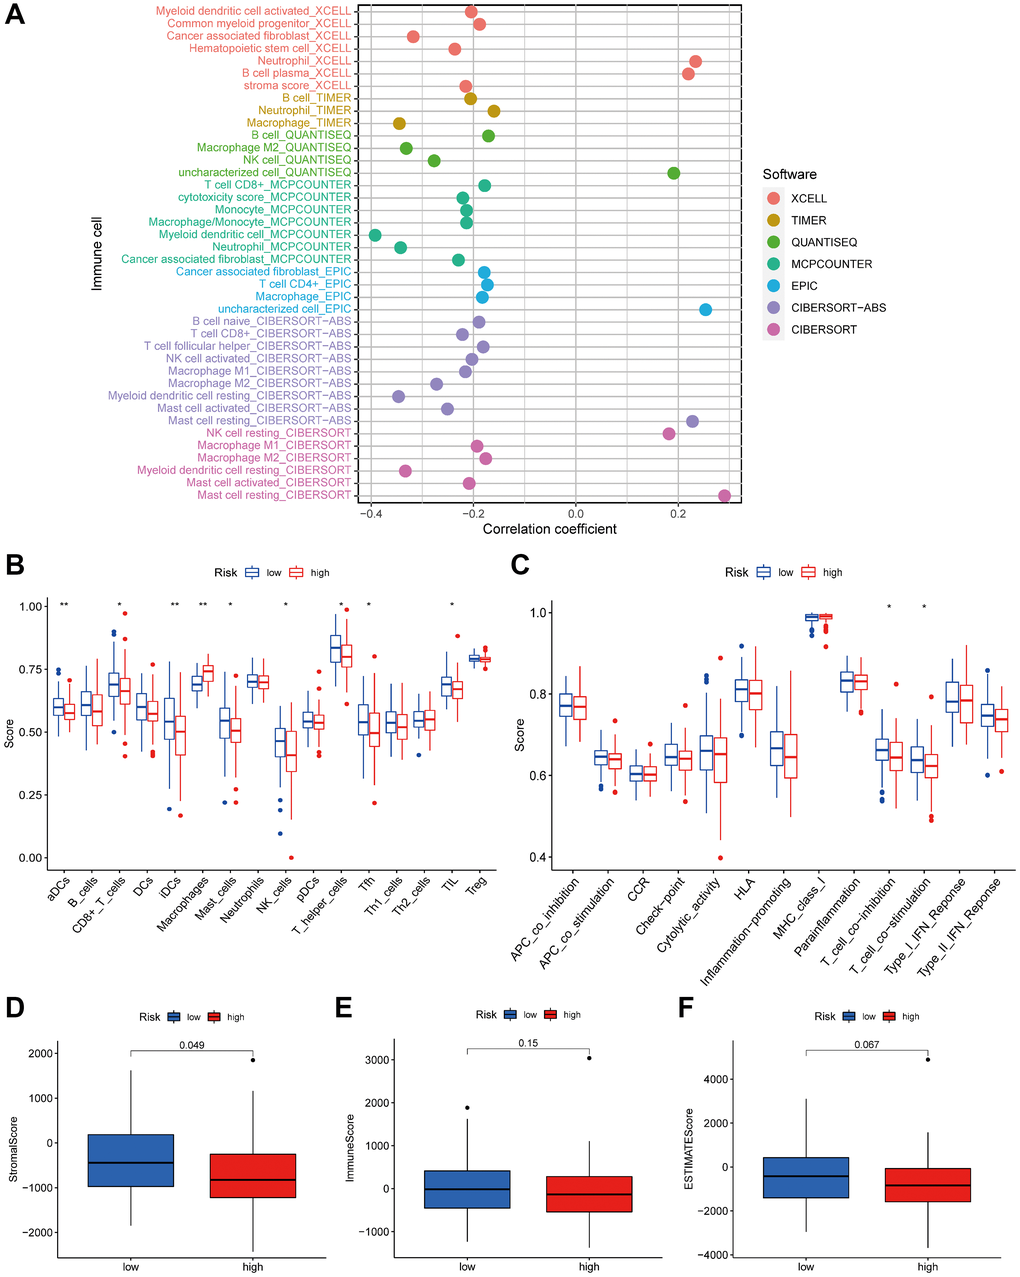
Figure 8.The low- and high-risk groups display different immune statuses. (A) The correlation of tumor-infiltrating cells with risk score using 7 algorithms. Immune cell infiltration (B) and immune-related functions or pathways (C) between the high- and low-risk groups. The stromal (D), immune (E) and ESTIMATE scores (F) between the high- and low-risk groups. *P < 0.05; **P < 0.01.