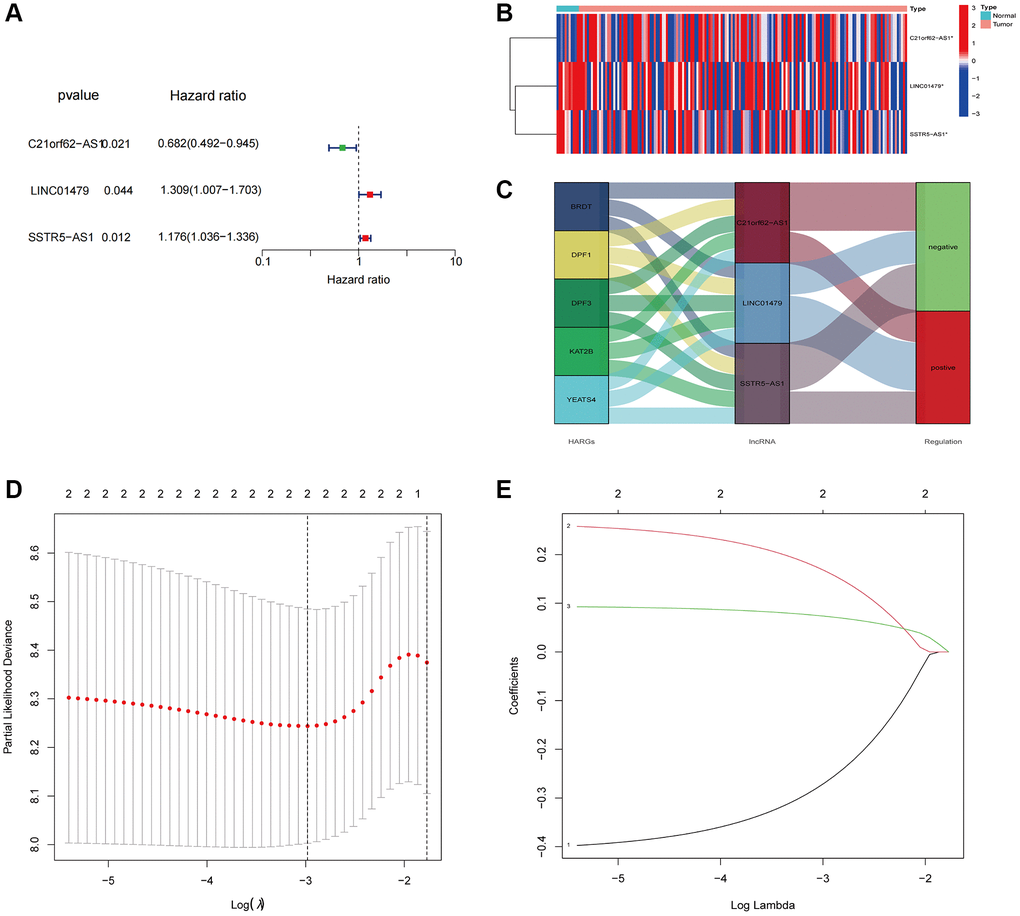
Figure 3.Constructed a HARlncRNA risk signature in the TCGA cohort. (A) Forest plot of 3 prognostic-related HARlncRNAs through univariate Cox analysis. (B) Expression patterns of 3 prognostic HARlncRNAs in normal and tumor tissues. (C) The Sankey diagram displayed the relationship between the 5 HARGs, 3 HARlncRNAs and ESCA prognosis. (D) Tuning parameter (λ) selection in LASSO model using cross-validation. (E) The LASSO coefficient profile of prognostic HARlncRNAs.