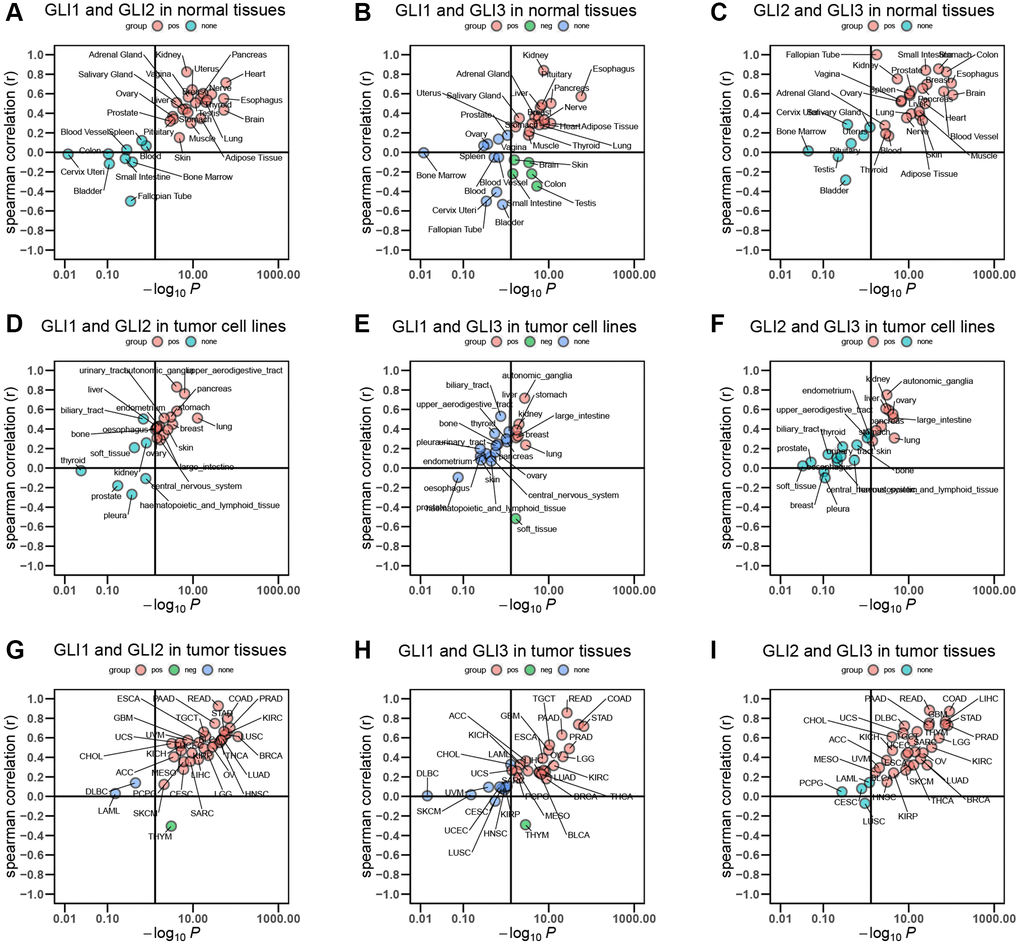
Figure 1.Correlation between GLI1, GLI2, and GLI3. Correlation of (A) GLI1 and GLI2, (B) GLI1 and GLI3, (C) GLI2 and GLI3 in normal tissues. Correlation of (D) GLI1 and GLI2, (E) GLI1 and GLI3, (F) GLI2 and GLI3 in tumor cell lines. Correlation of (G) GLI1 and GLI2, (H) GLI1 and GLI3, (I) GLI2 and GLI3 in tumor tissues.