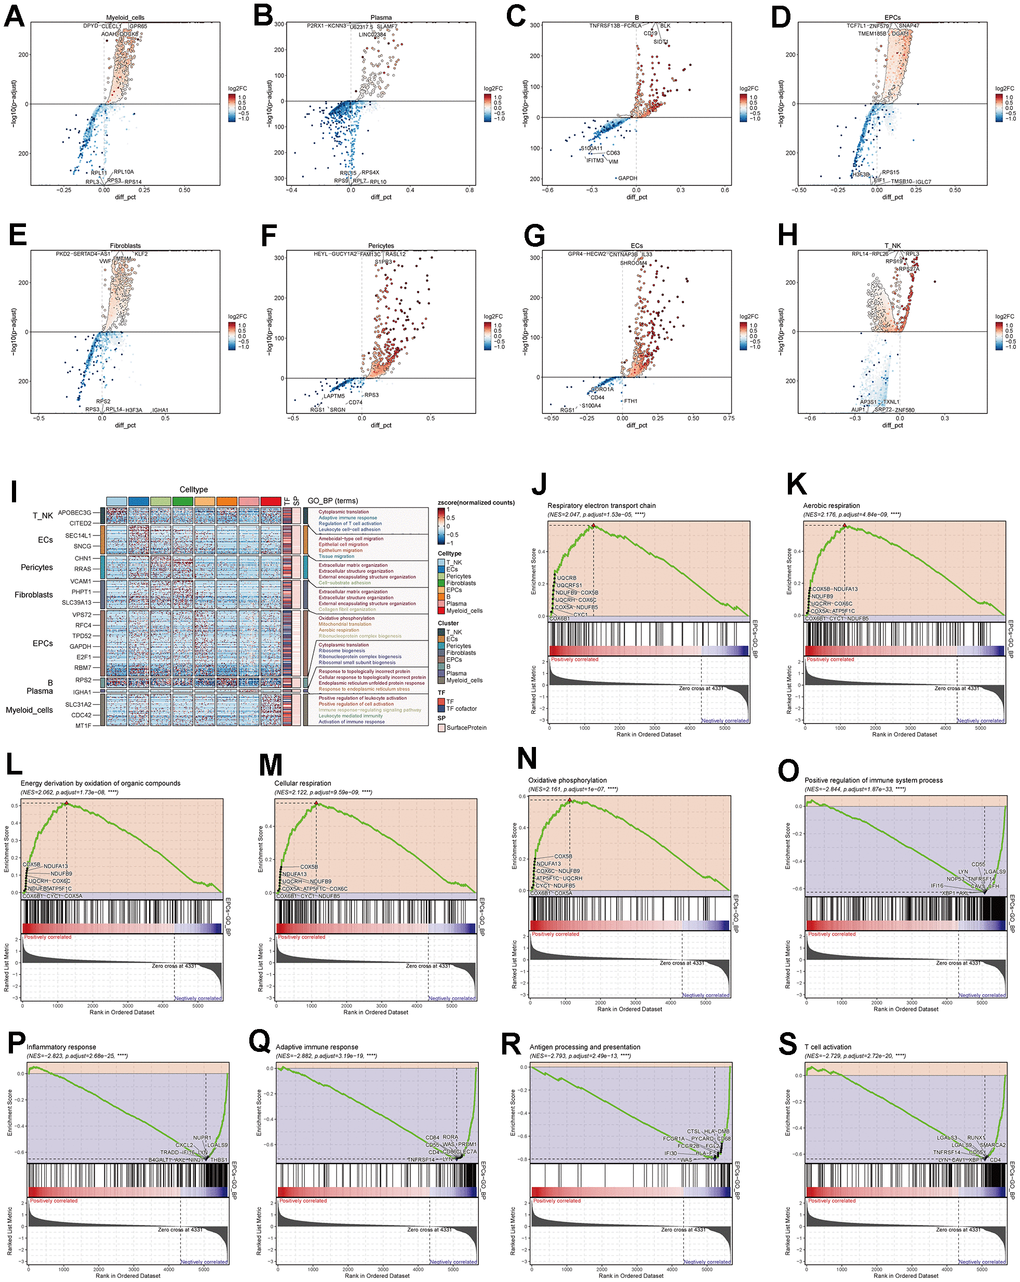
Figure 3.Enrichment analysis of major cell clusters. (A–H) Differential gene distribution in major ovarian cancer cell clusters compared to other cell types, displaying the top 5 upregulated and downregulated genes for each. (I) GO enrichment analysis for major cell clusters. (J–S) GSEA enrichment analysis for EPCs, displaying 5 pathways selected from both low and high expression groups.