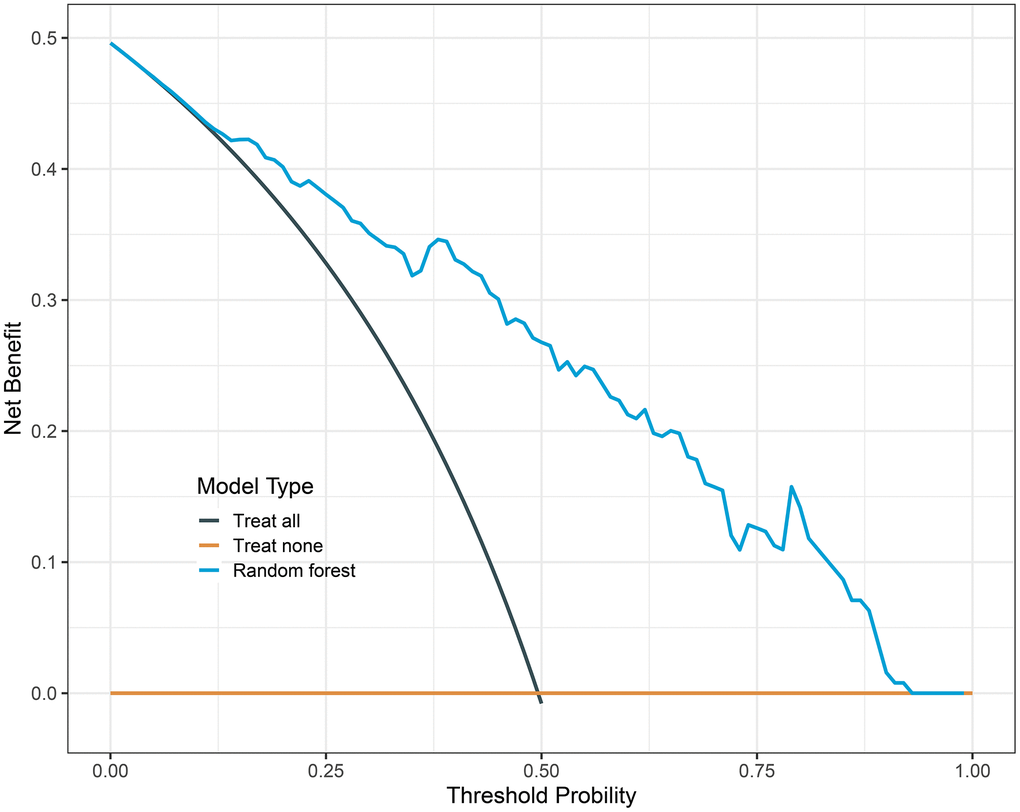
Figure 3.Decision curve analysis of random forest model. The black line is the net benefit for a strategy of treating all men; the yellow line is the net benefit of treating none. The y-axis indicates the overall net benefit, which is calculated by summing the benefits (true positive results and subtracting the harms (false positive results).