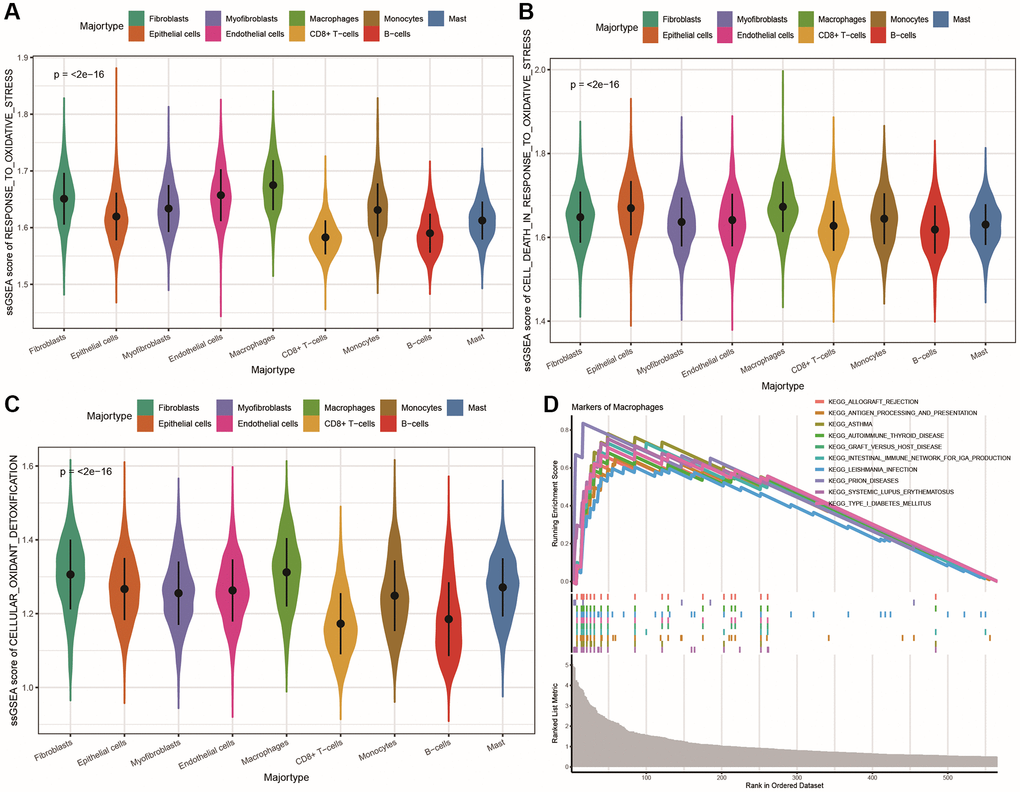
Figure 2.Differences in oxidative stress and communication between subpopulations of cells. (A–C) Violin plots showing the differences in ssGSEA scores for oxidative stress response, oxidative stress-induced cell death, and cellular antioxidant defense among different cell populations; (D) Line plot of KEGG pathway GSEA enrichment results for all marker genes of macrophages.