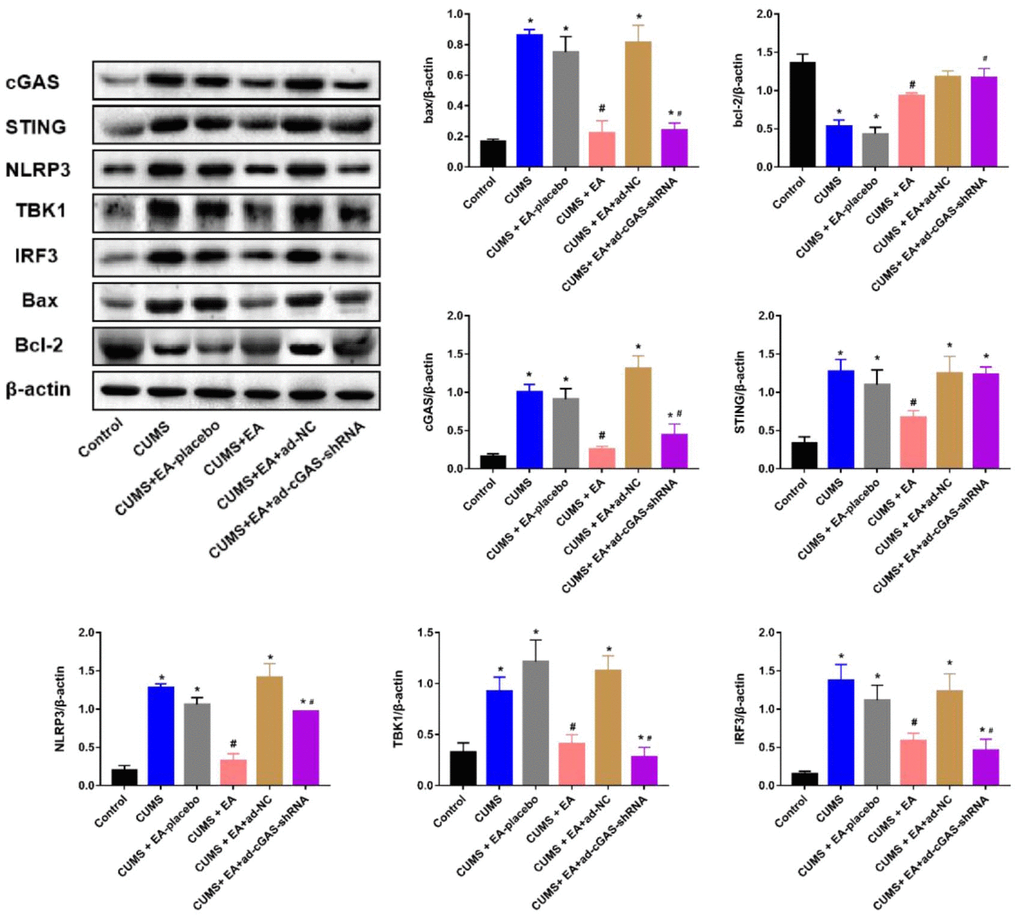
Figure 4.The impact of EA and knockdown of cGAS on the expression level of Bax, Bcl-2, cGAS, STING, TBK1, IRF3, and NLRP3 was determined by Western blotting (*p<0.05 vs control, #p<0.05 vs CUMS).
Figure 4 — Electroacupuncture alleviates the symptom of depression in mice by regulating the cGAS-STING-NLRP3 signaling | Aging