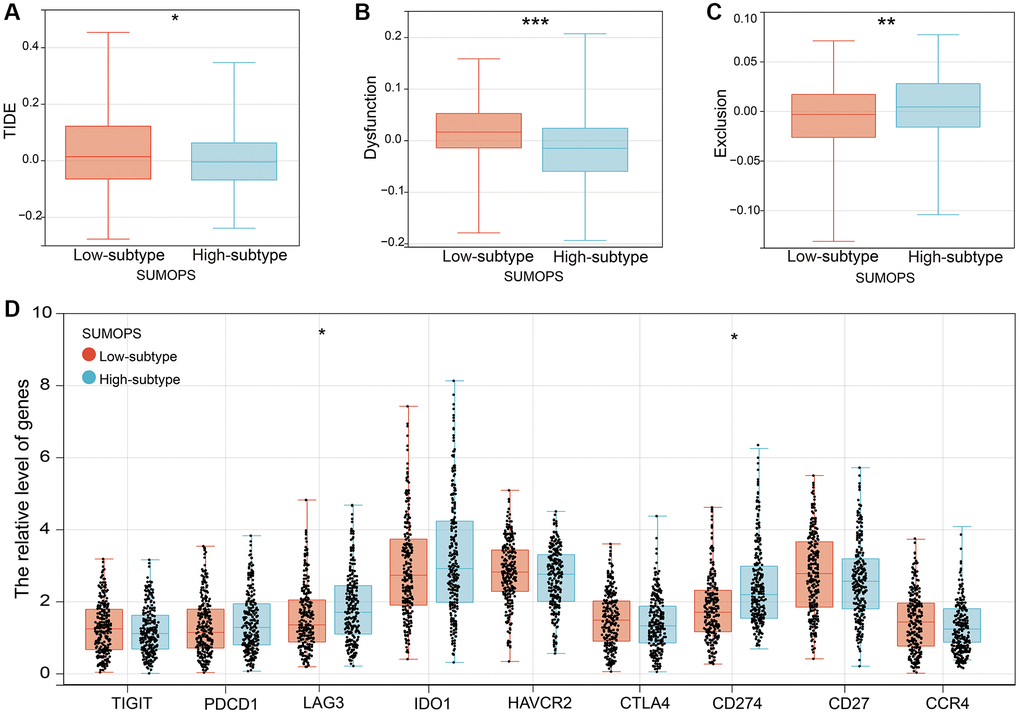
Figure 6.The prognostic value of SUMOPS for ICI treatment. (A–C) Scores of (A) TIDE, (B) T cell dysfunction and (C) T cell exclusion in different SUMOPS subtypes. (D) Box plots illustrating the relationships between SUMOPS subtypes and the expression of immune checkpoints. *p < 0.05; **p < 0.01, ***p < 0.001.