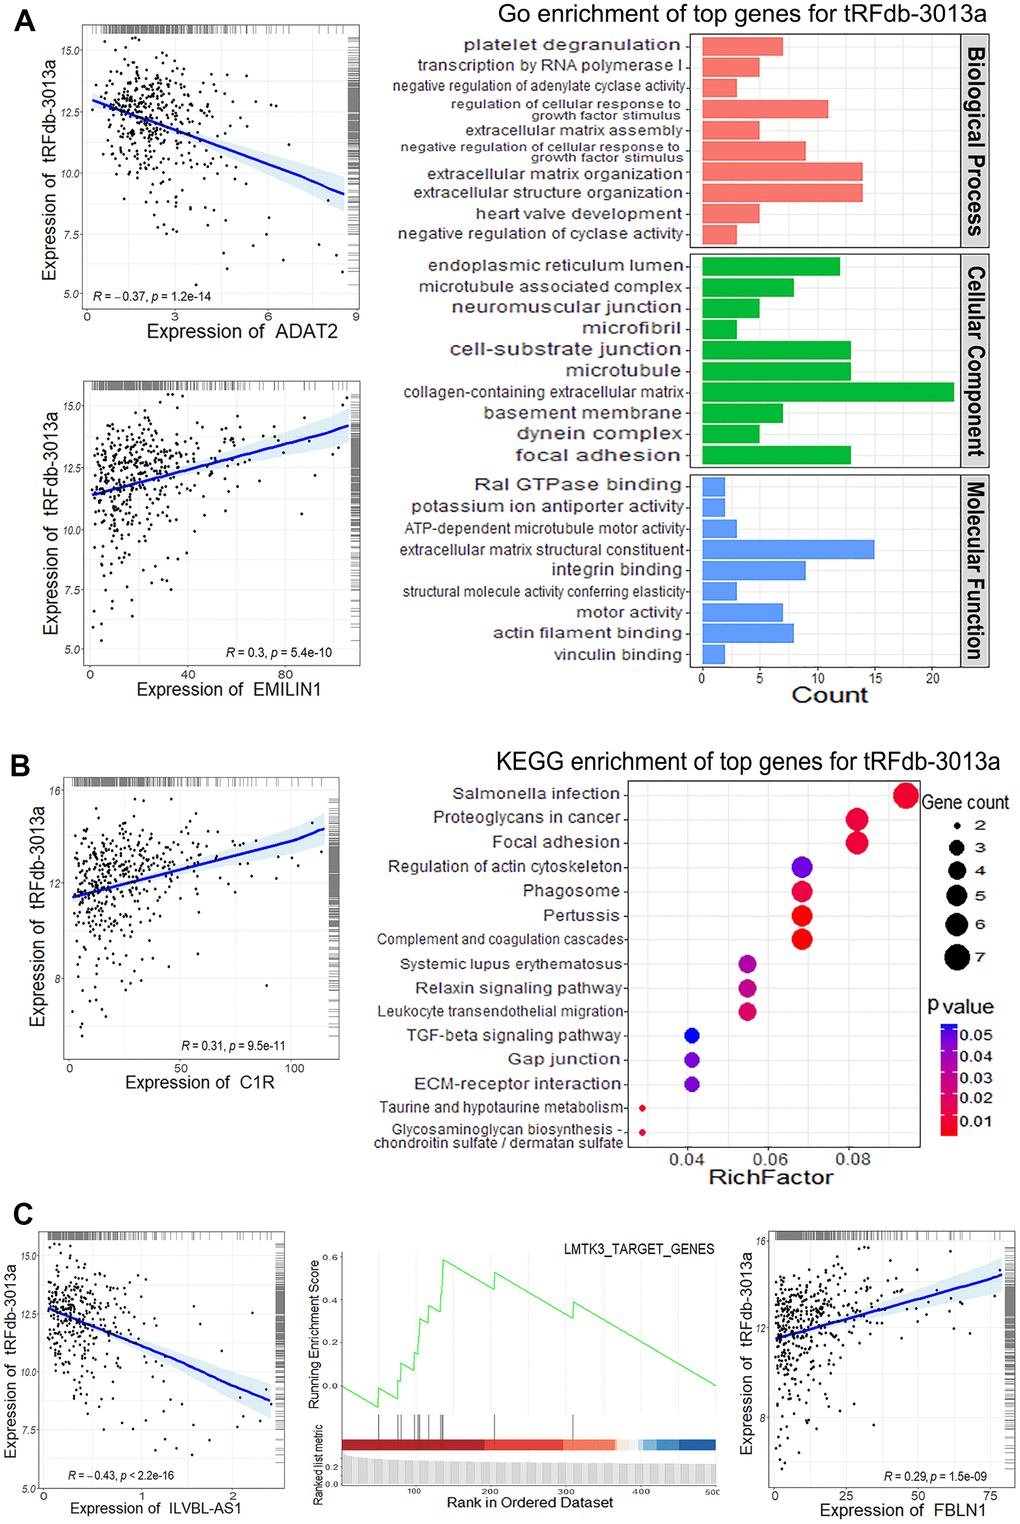
Figure 7.The enrichment analysis of tRFdb-3013a related-genes within TCGA-COAD data. (A) The top gene ontology (GO) terms, including biological process, cellular component and molecular function. (B) The top KEGG pathway for tRFdb-3013a related-genes. The correlation scatter-plots of tRFdb-3013a and its related-genes (ADAT2, EMILIN1, and C1R). (C) GSEA (gene set enrichment analysis) plots of the molecular signatures, the scatter plots for tRFdb-3013a and its related-genes (ILVBL-AS1, FBLN1).