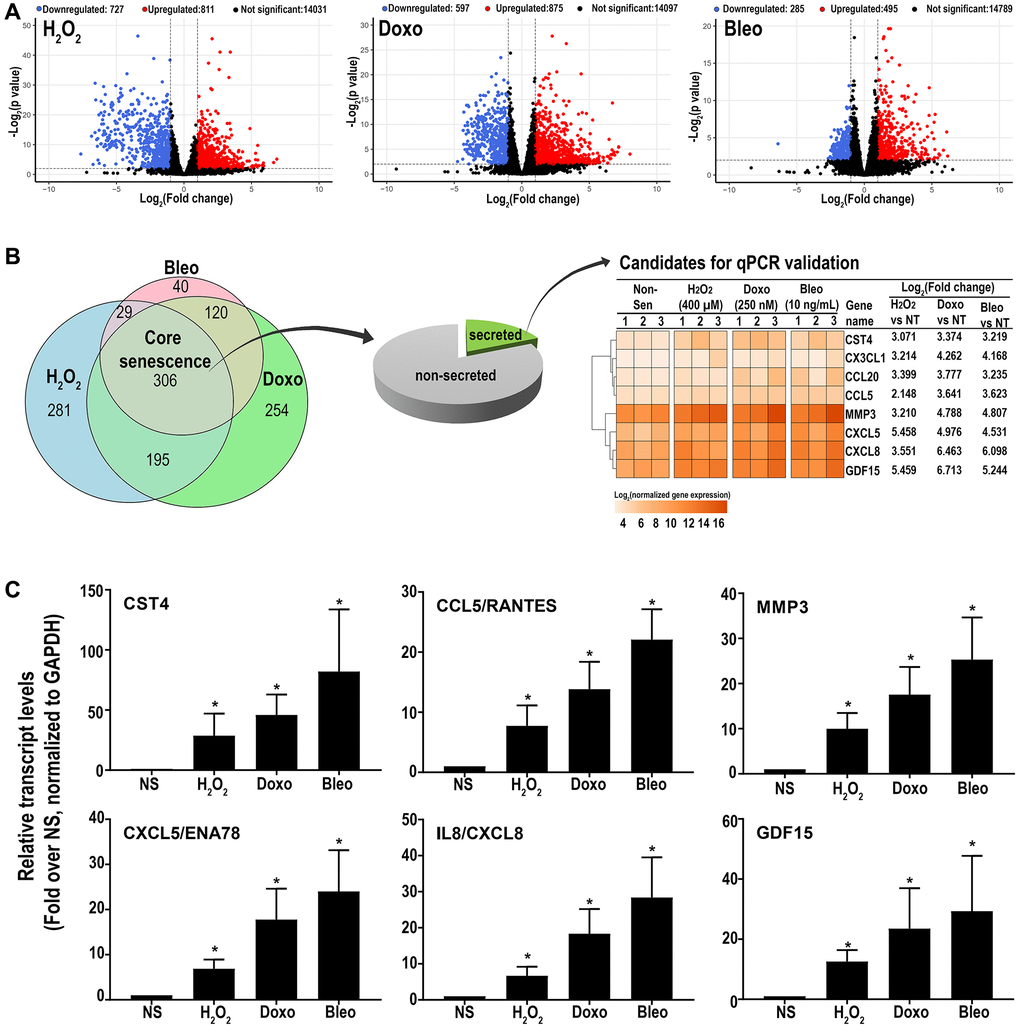
Figure 2.(A) Volcano plots of differentially expressed transcripts versus non-senescent proliferating (NS) cells (B) A Venn diagram showing a ‘core senescent profile’ of transcripts upregulated by all senescence inducers and heatmap of the eight candidates selected for validation at the transcriptomic level by qPCR (C). Data are Mean ± SEM (*p < 0.04 versus NS) senescent or non-senescent fibroblast lines from 7 subjects. (C) Quantitative RT-PCR assay results of 6 genes in the core senescence SASP demonstrates increased expression of all of the genes by any of the senescence inducing agents.