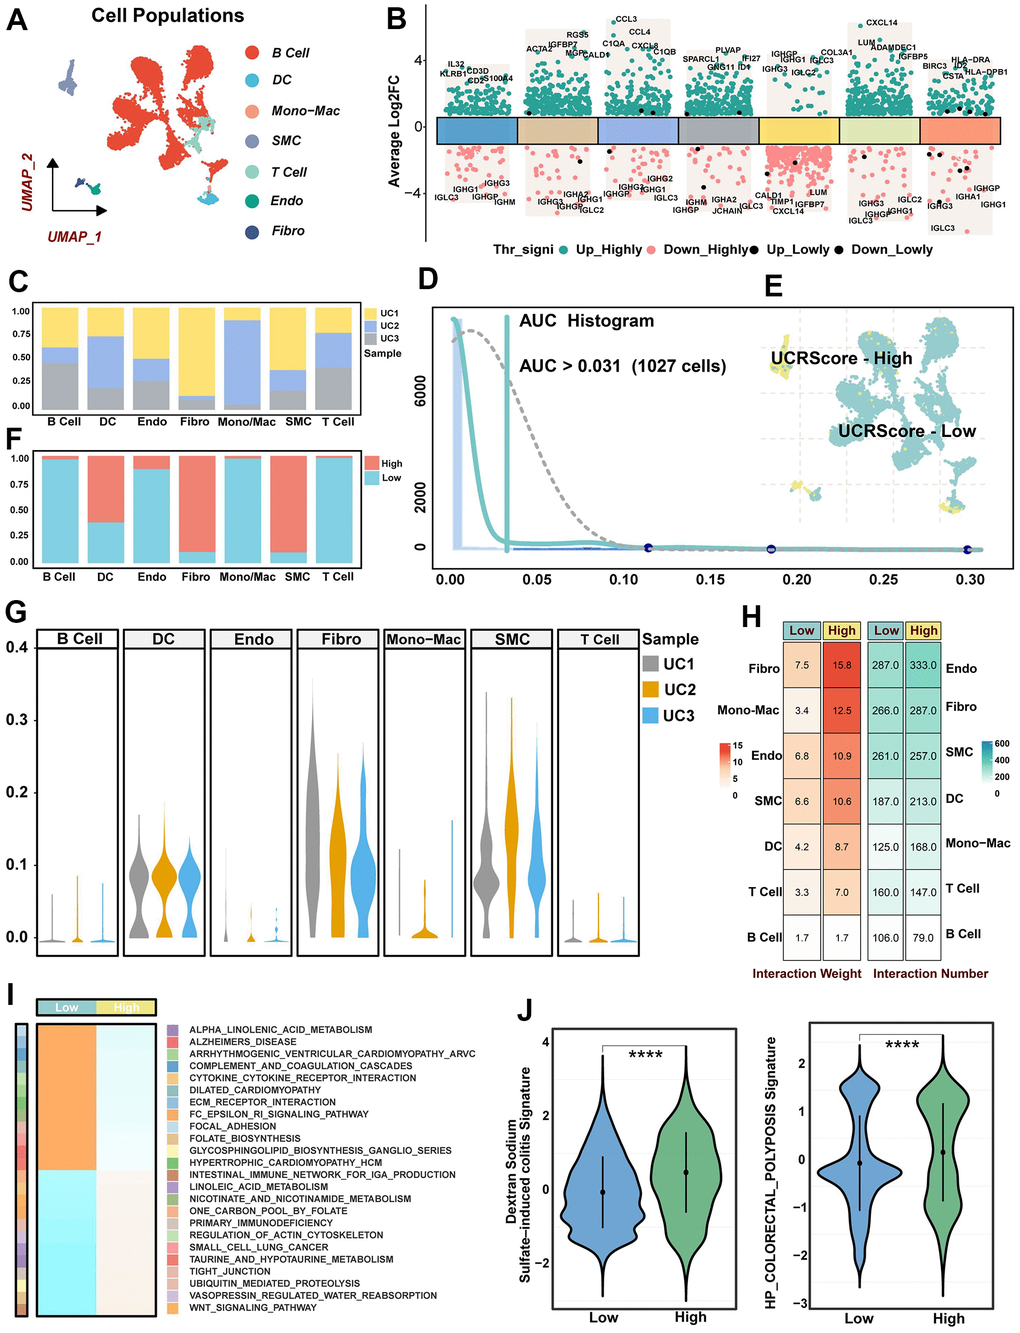
Figure 7.Single-cell resolution interpretation of the biological significance of UCRScore. (A) UMAP visualization showing the composition of 7 main subtypes derived from UC patient samples. (B) Differential expression analysis showing dysregulated genes across each cluster, with green representing up-regulated genes and red representing down-regulated genes. (C) The proportion of different samples in each cell cluster. (D) AUC area under the calculation of the UCRGs gene set in cell clusters. 1027 cells displayed higher UCRScore at a 0.031 threshold. (E) Cells of UC samples were colored by UCRScore. (F) The bar chart shows the percentage of each cell type in the two states of UCRScore-high and UCRScore-low. (G) The proportion of different cell cluster samples in each UC samples. (H) Cell-cell ligand-receptor network analysis. The number and weight interaction in different cells. (I) GSEA integrative analysis revealed significantly dysregulated pathways. (J) Distribution of published biological signatures in the UC between UCRScore-High and UCRScore-Low states.