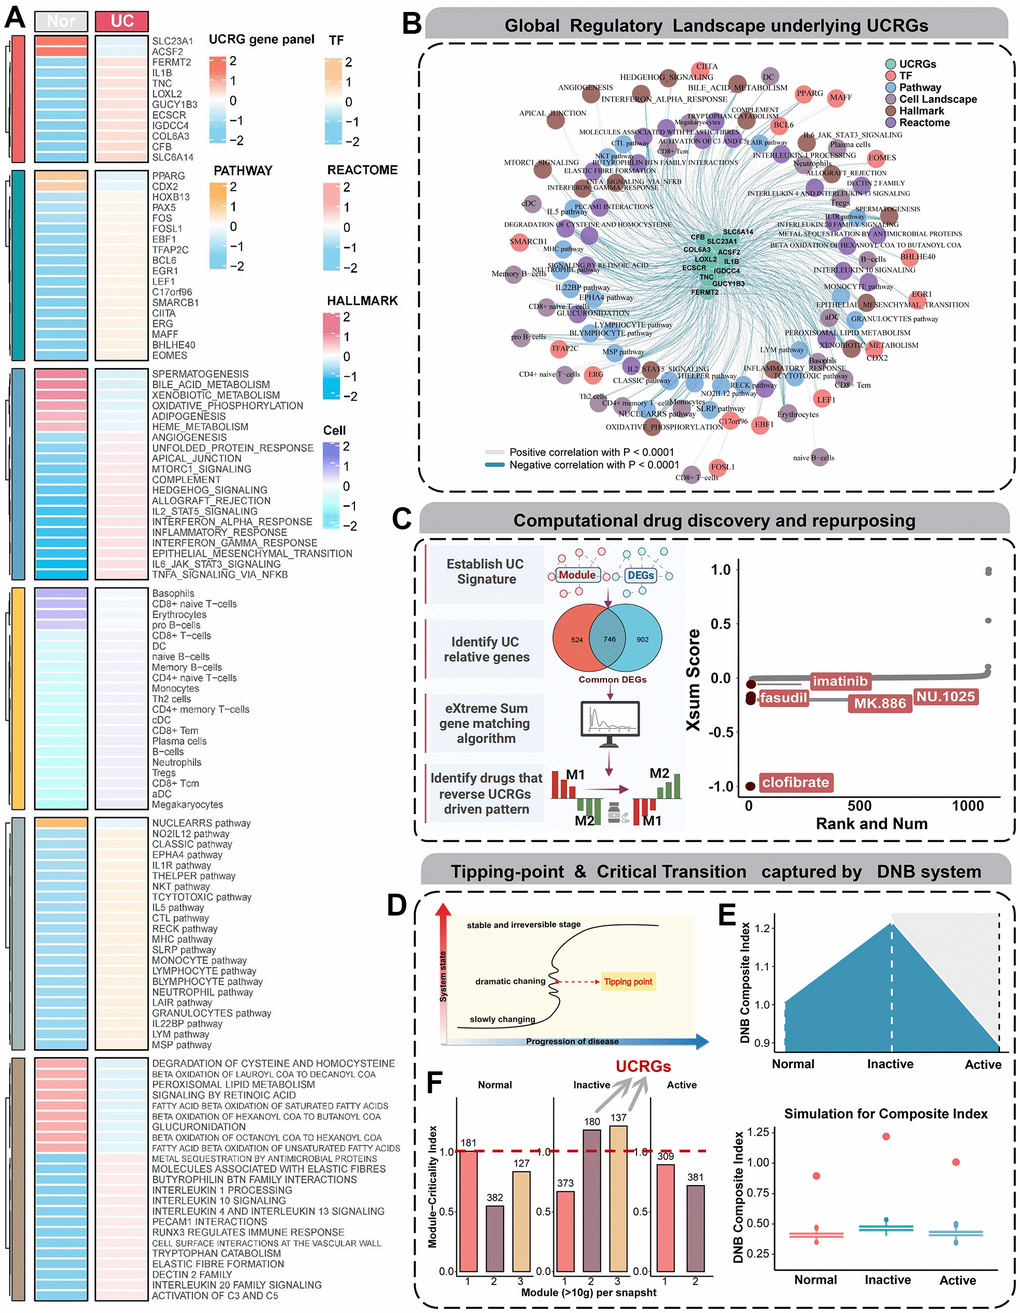
Figure 6.Global regulatory landscape, benefits of therapeutic drugs and DNB analysis. (A) Heatmap showing the distribution of dysregulated regulatory components from multiple dimensions. (B) The interaction network centered on UCRGs shows the tight modulation relationship of important regulators. (C) Schematic showing UCRGs-driven therapeutic discovery and results from the eXtreme Sum signature matching method. Lower scores imply higher reversal effectiveness and greater application potential. (D) A schematic diagram illustrates a stage transition during UC occurrence. The critical period after the early period changes the state of the biological system qualitatively and thus plays a key role in biological processes. (E) Line and box plots used to visualize the simulated DNBscore. The plot shows that, based on the CIs at all time points in the gene expression profile, the key transition occurs at the inactive stage. (F) The MCI of GSE53306 cohort validates that UCRGs exist in the inactive stage module of UC transformation.