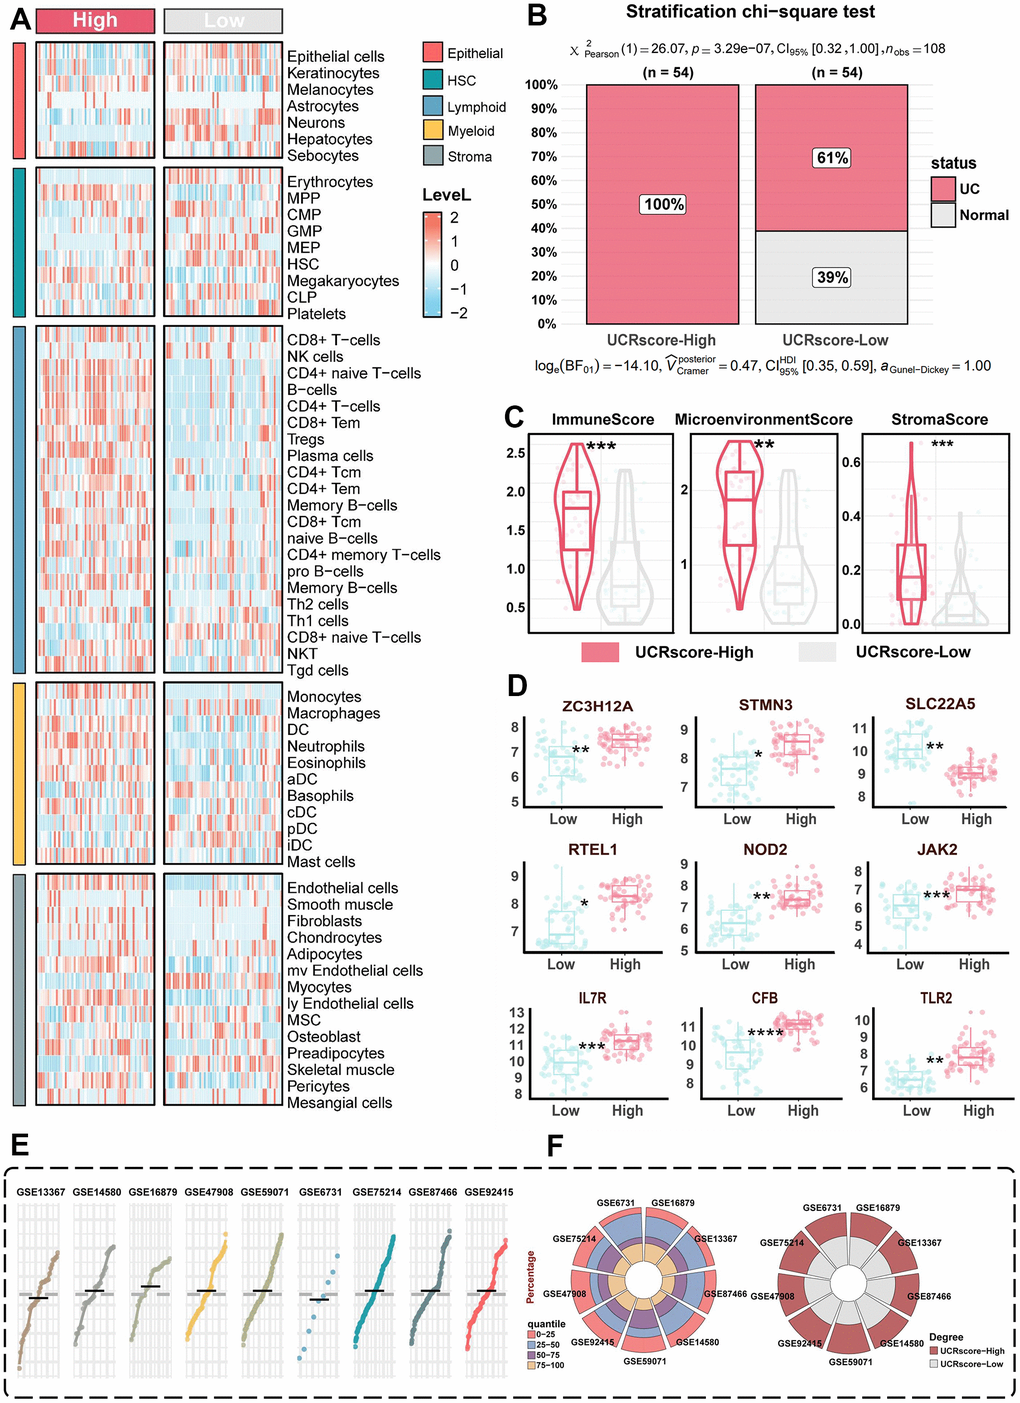
Figure 5.The biological significance of UCRGs. (A) Heatmap shows the abundance distribution of five cell types in different UCRScore groups. (B) Chi-square test shows that the proportion of different scores in the two groups. (C) The distribution of xcell quantification between UCRScore-High and UCRScore-Low groups comparison of differences between high and low UCRScore in xCell score. (D) Distribution of genes related to UC occurrence between high and low UCRScore groups. (E) UCRScore was calculated among UC individuals in nine bulk cohorts. The gray dashed line represents the median UCRScore of all samples. (F) Left: Barplot t showing proportion of UCRScore quartiles across nine bulk cohort. Right: Percentage of samples classified as UCRScore-High and UCRScore-Low in nine bulk cohorts, with the median UCRScore as the cutoff (gray dashed line in the above gene panle).