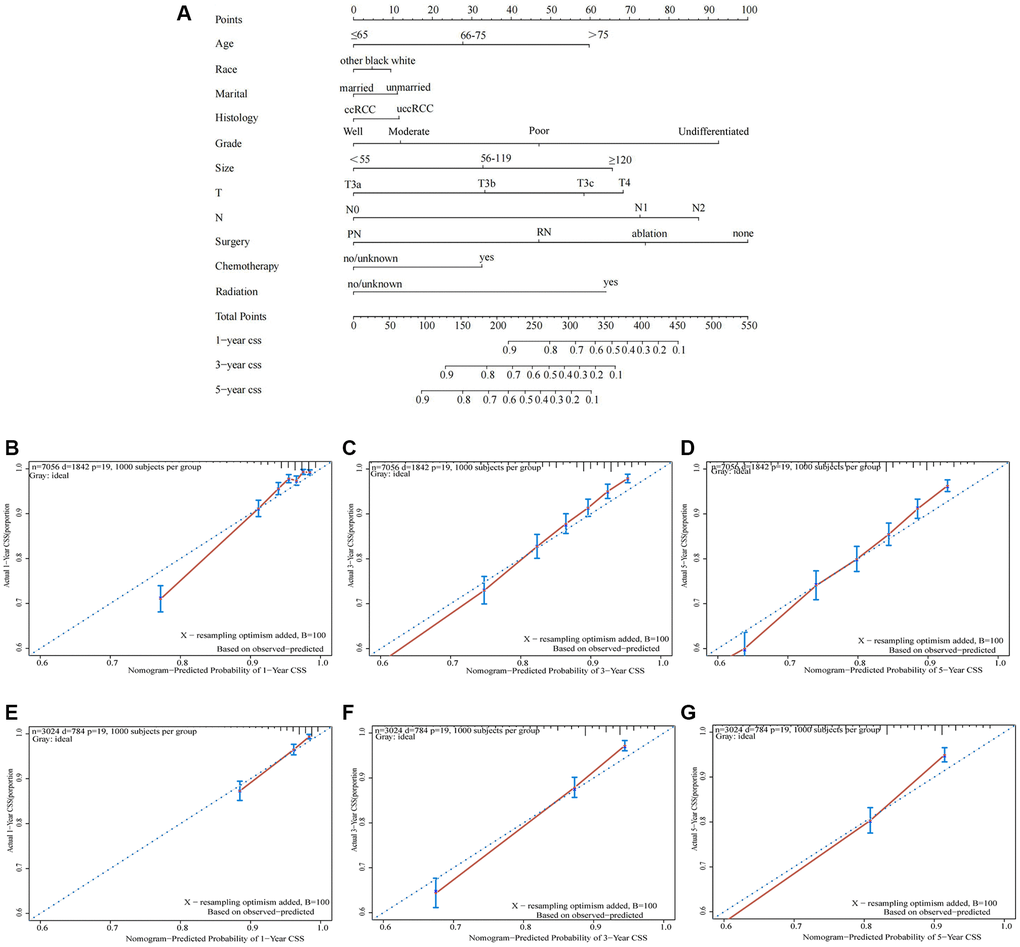
Figure 4.A nomogram predicting 1-, 3- and 5-year CSS of patients with locally advanced RCC. (A) Calibration plots of the relationship between predicted probabilities and actual values based on nomograms. (B–D) calibration curves for 1-year, 3-year and 5-year CSS in the training cohort; (E–G) calibration curves for 1-year, 3-year and 5-year CSS in the validation cohort).