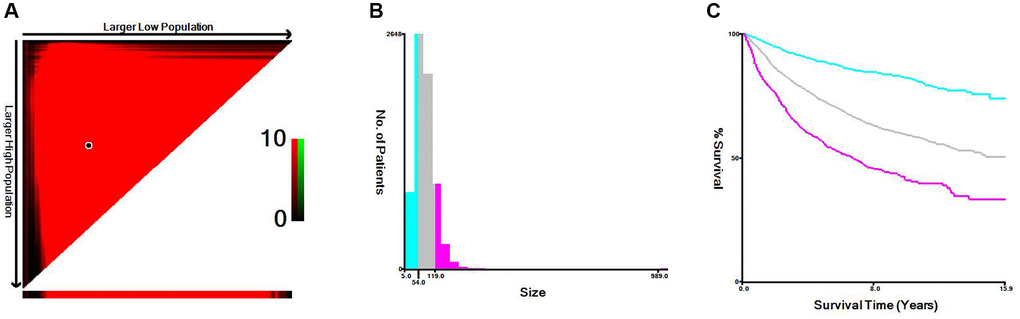
Figure 2.X-tile analysis of cancer-specific survival according to tumor size. (A) X-tile plot of tumor size. (B) Cutoffs were depicted with histogram of the entire cohort. (C) Prognoses based on cutoffs were illustrated using Kaplan–Meier plots.
Figure 2 — Development and validation of a nomogram for predicting the impact of tumor size on cancer-specific survival of locally advanced renal cell carcinoma: a SEER-based study | Aging