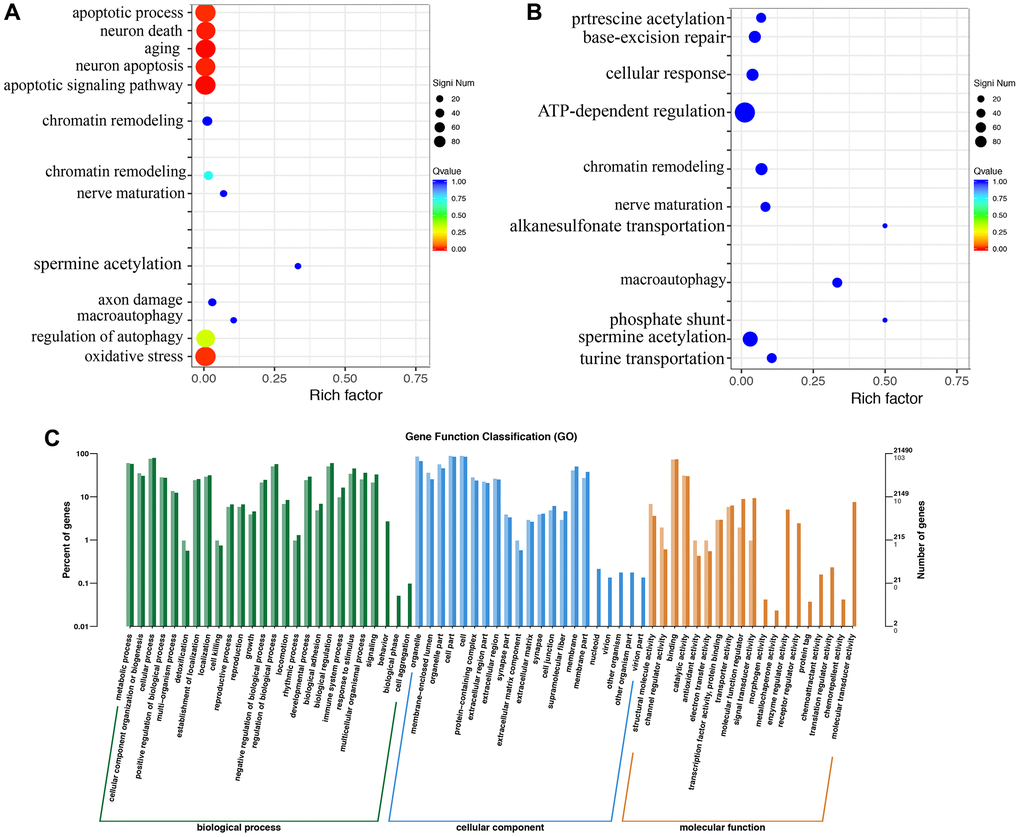
Figure 5.Gene ontology enrichment analysis using brain tissues. (A) Gene ontology pathway enrichment analysis in the group MCAO; (B) Gene ontology pathway enrichment analysis in the group MCAO+Dex; (C) Differential gene GO annotation classification histogram. n = 3.