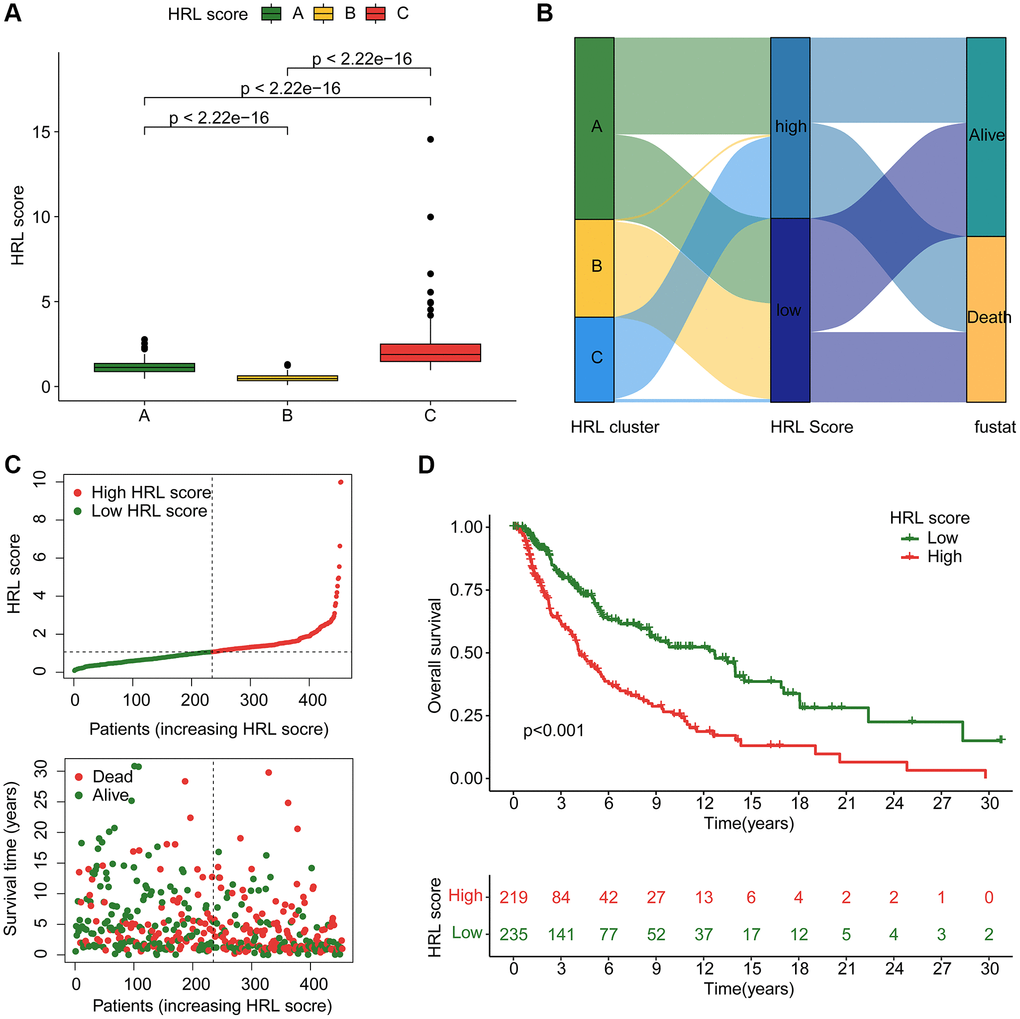
Figure 4.Construction of HRLs risk model in CM. (A) HRL score in CM subtypes. (B) Relationship between HRL score, CM cluster, HRL score, and clinical survival status. (C) Construction of risk model for CM. (D) Clinical prognostic analysis of CM samples in low-risk and high-risk groups.