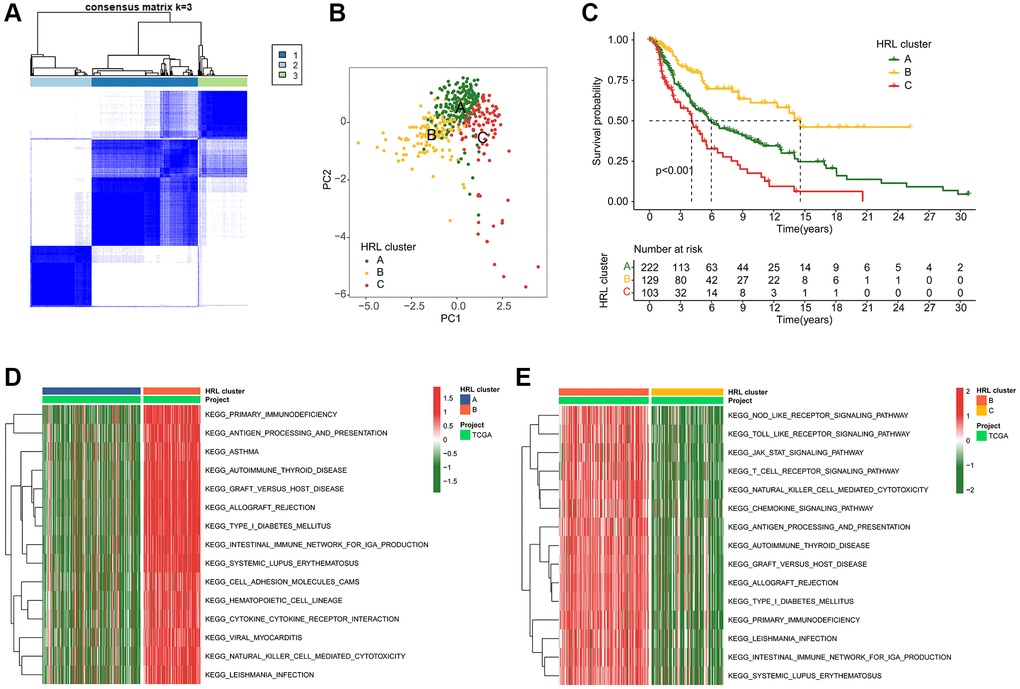
Figure 2.Identification of molecular subtypes for CM. (A) Unsupervised consensus clustering analysis of CM. (B) PCA score plot depicting cluster subgroups. (C) Clinical survival outcomes of CM in the clusters. (D, E) GSVA comparing KEGG signaling pathways among CM subtypes.