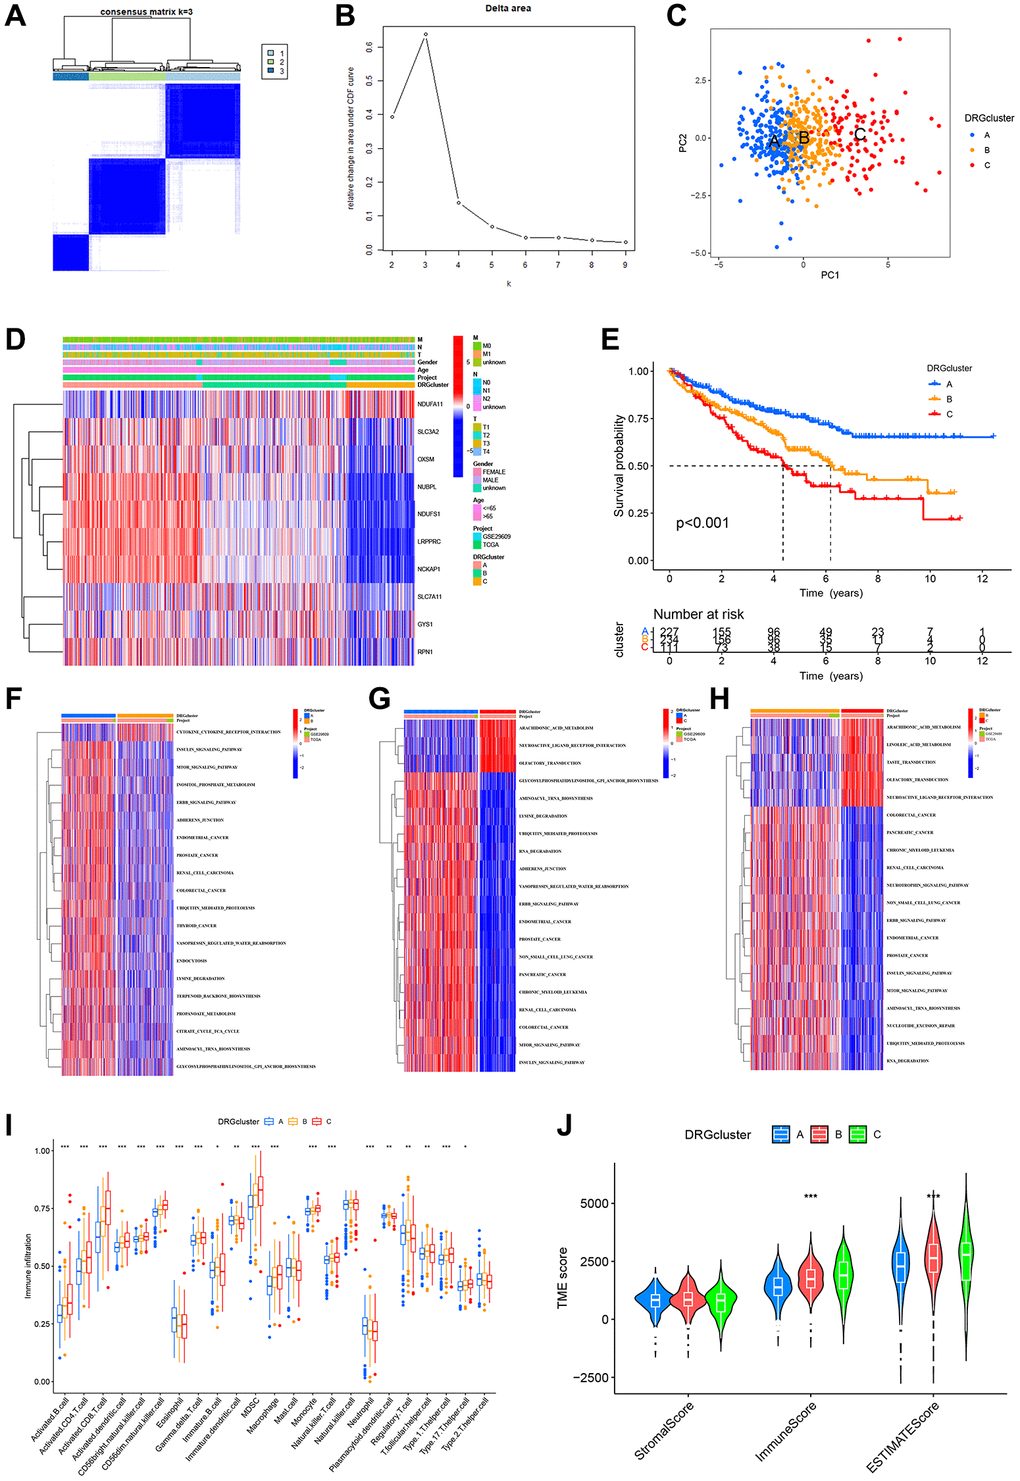
Figure 4.Identification of DRG-related molecular subtypes and its GSVA and immunological analysis. (A) Consistency matrix for the three clusters. (B) The cumulative distribution function based on the sign. (C) Principal component analysis. (D) Heat map showing the clinical characteristics of molecular subtypes. (E) KM survival curves for three molecular subtypes. (F–H) The GSVA heat map displayed the discrepancy in pathways between different molecular subtypes. (I) Differences in immune cell infiltration between different molecular subtypes. (J) TME scores for the 3 molecular subtypes.