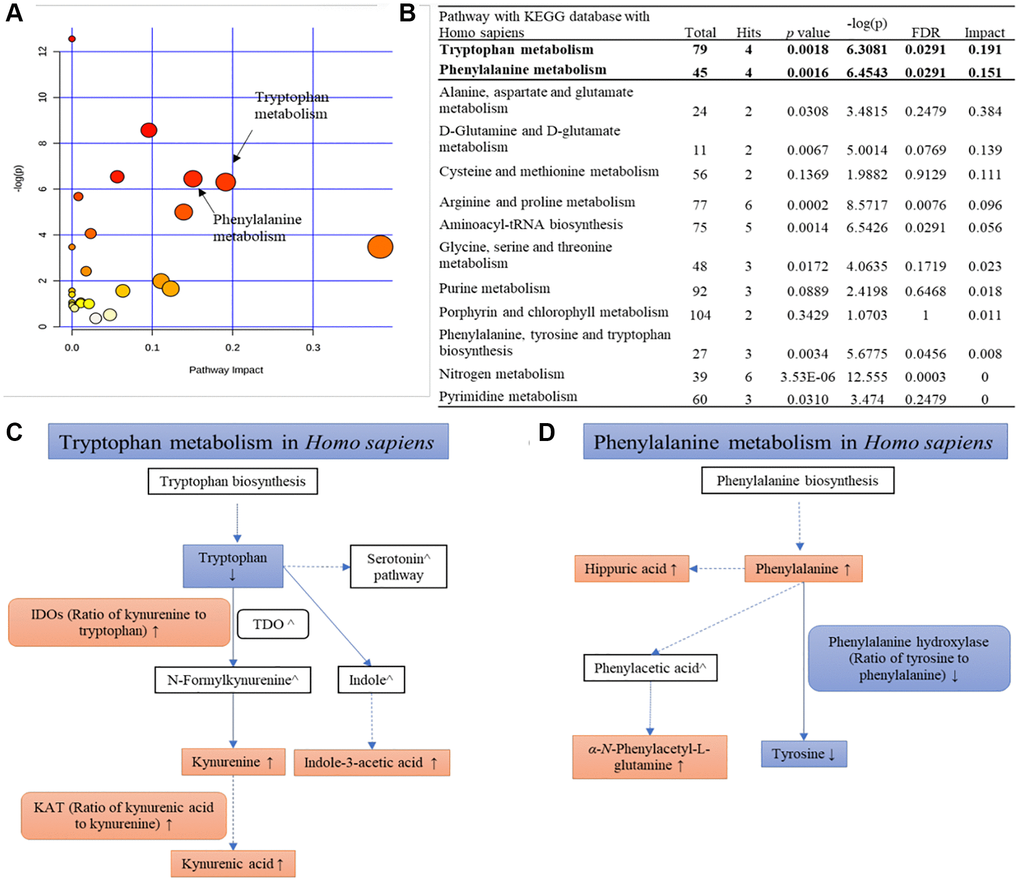
Figure 2.KEGG pathway analysis of all SAMs. (A) An overview view of pathway analysis; (B) Table of the matched pathway with p-values from pathway enrichment analysis and pathway impact values from the pathway topology analysis using MetaboAnalyst 4.0 and KEGG database (Hits ≥ 2); (C, D) Simplified pathways of tryptophan metabolism and phenylalanine metabolism with the change trends of metabolites and their ratios at Stage 4 compared with the normal group.