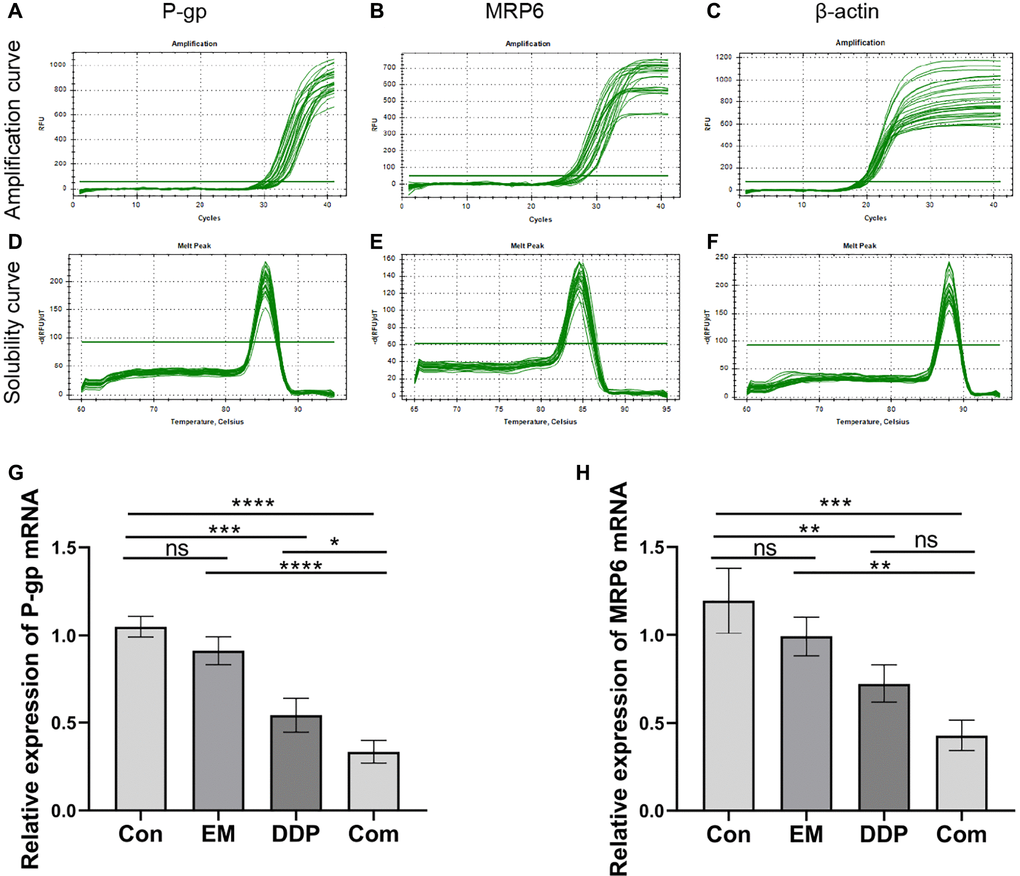
Figure 6.The mRNA expression of P-gp and MRP6 by EM combined with DDP. (A–C) Amplification curve of P-gp, MRP6, and β-actin. (D–F) Solubility curve of P-gp, MRP6, and β-actin. (G) Relative mRNA expression of P-gp. (H) Relative mRNA expression of MRP6. All experiments were repeated three times, nsp > 0.05, *P < 0.05, **P < 0.01, ***P < 0.001, ****P < 0.0001.