Submit an Article
Navigate
Home
Editorial Board
Editorial Policies
Current Volume
Archive
Scientific Integrity
Publication Ethics Statements
Interviews with Outstanding Authors
Newsroom
Sponsored Conferences
Podcast
Contact
Special Collections
Submit an Article
Online ISSN: 1945-4589
Research Paper
|
Volume 16, Issue 4
|
pp. 3280–3301
Disulfideptosis-associated lncRNAs reveal features of prognostic, immune escape, tumor mutation, and tumor malignant progression in renal clear cell carcinoma
Back to article
Figure 5
(5 of 12)
−
100%
+
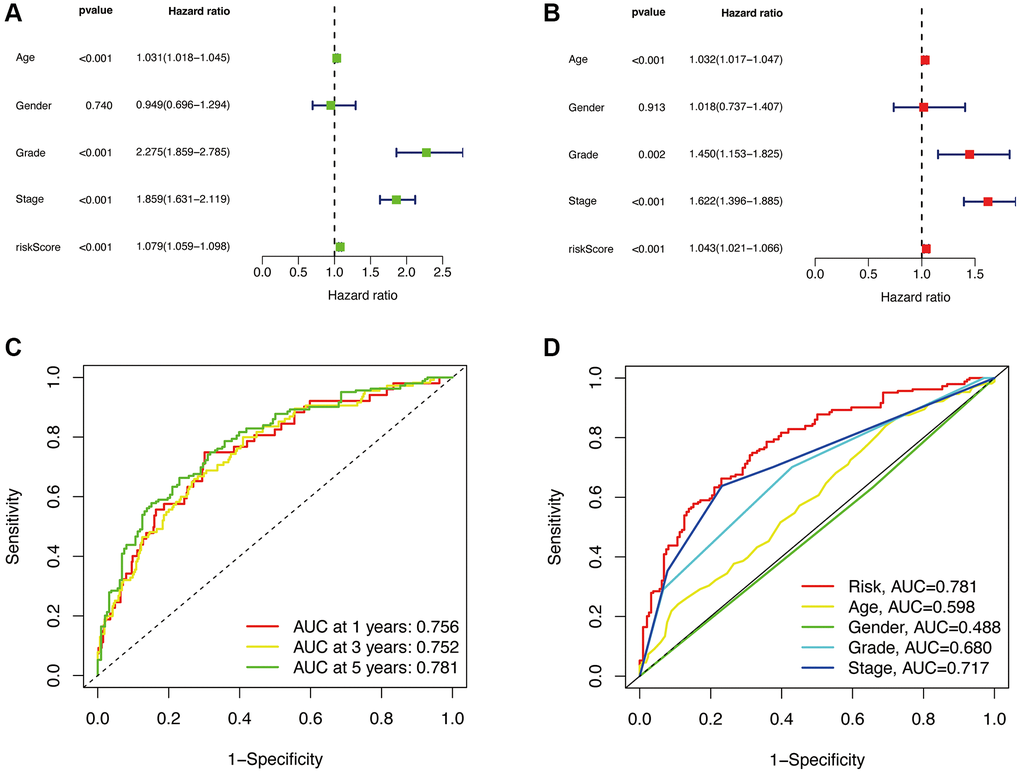
Figure 5.
Independent prognostic analysis.
Univariate analysis (
A
). Multivariate analysis (
B
). The ROC curve of the risk model for 1, 3, and 5 years (
C
). The 5-year ROC curve of the risk model in relation to other clinical characteristics (
D
).