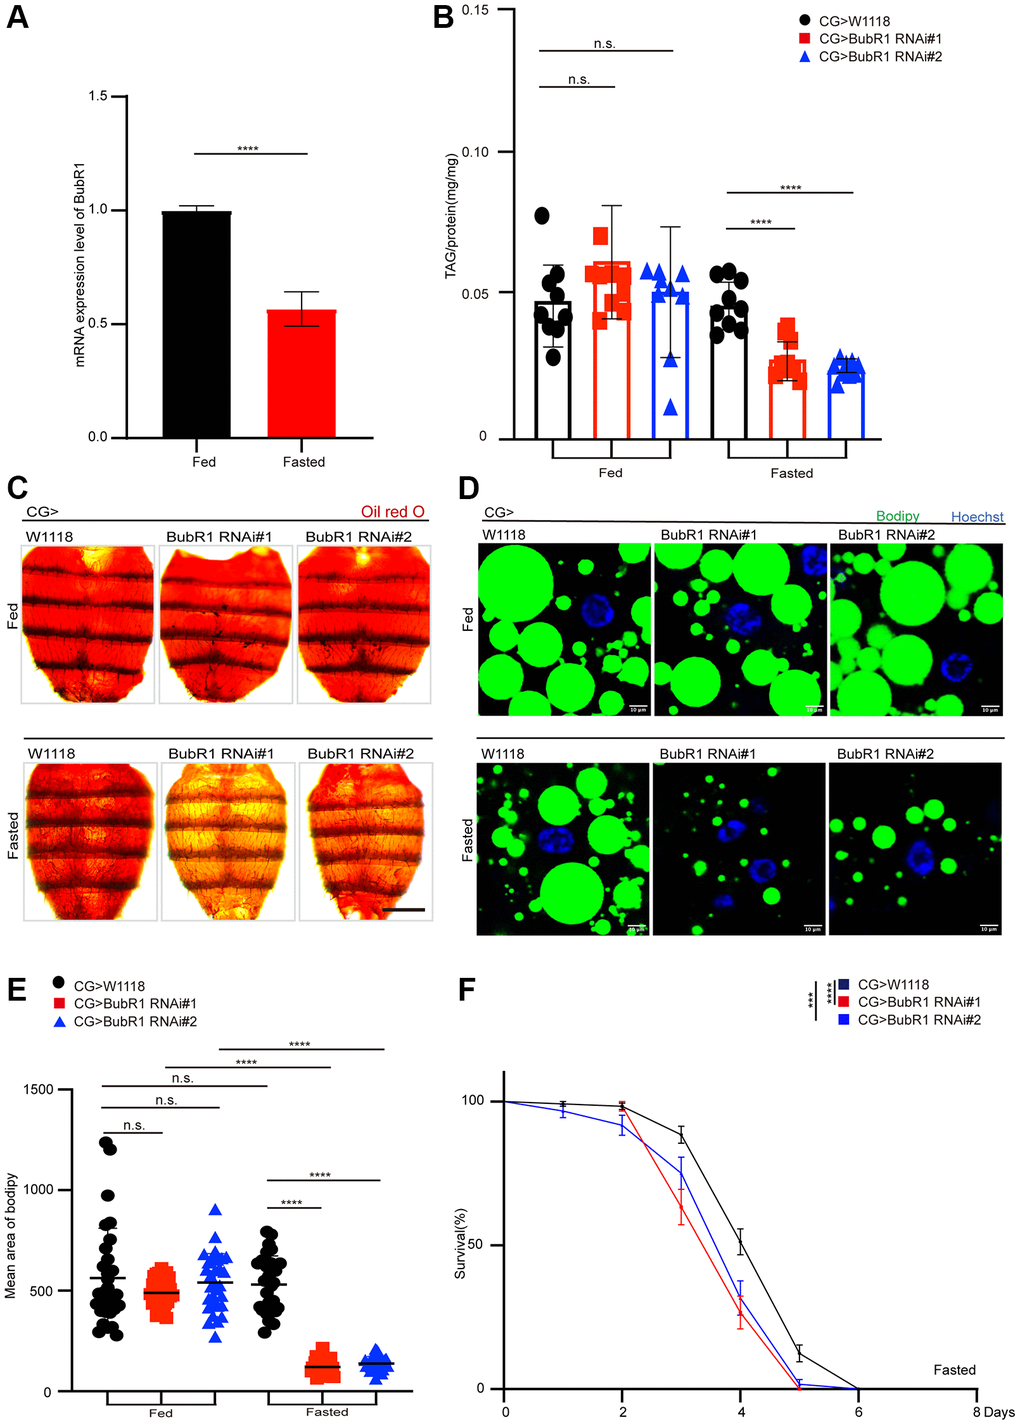
Figure 2.BubR1 functions autonomously in Drosophila fat body to control lipid metabolism upon fasting. (A) The mRNA expression level of BubR1 in the fat body of wildtype before and after starvation (72 h). The ratio of each band indicates the relative amount of BubR1 normalized by rp49 expression. Results are representative of three biological repetitions. (B) The total triglyceride (TAG) levels of flies before and after starvation (72 h) with specially expressing W1118, BubR1 RNAi#1 and BubR1 RNAi#2 in the fat body driven by CG-GAL4. n = 9 samples. (C) Representative images of Oil red O (ORO) stain of dissected fat bodies from female flies before and after starvation (72 h) with specially expressing W1118, BubR1 RNAi#1 and BubR1 RNAi#2 in the fat body driven by CG-GAL4. (D) Bodipy stain of dissected carcass/fat body of flies before and after starvation (72 h) with specially expressing W1118, BubR1 RNAi#1 and BubR1 RNAi#2 in the fat body driven by CG-GAL4. Bodipy (neutral lipids; green) and Hoechst (Hoechst; blue) detected by fluorescent histochemistry. (E) Quantification of the mean area of lipid droplets among the more than 30 ROI (region of interest) from flies before and after starvation (72 h) with specially expressing W1118, BubR1 RNAi#1 and BubR1 RNAi#2 in the fat body driven by CG-GAL4. Each dot corresponds to one ROI. (F) Starvation resistance of female flies with specially expressing W1118, BubR1 RNAi#1 and BubR1 RNAi#2 in the fat body driven by CG-GAL4. n = 4 cohorts (total 80 flies). Data are presented as percents and SE. Scale bars represent 1000 μm (C), 10 μm (D). Without noted, Data are presented as mean and SD. Student’s t-tests are performed. *p < 0.05, **p < 0.01, ***p < 0.001, ****p < 0.0001, and Abbreviation: n.s.: non-significant represents p > 0.05.