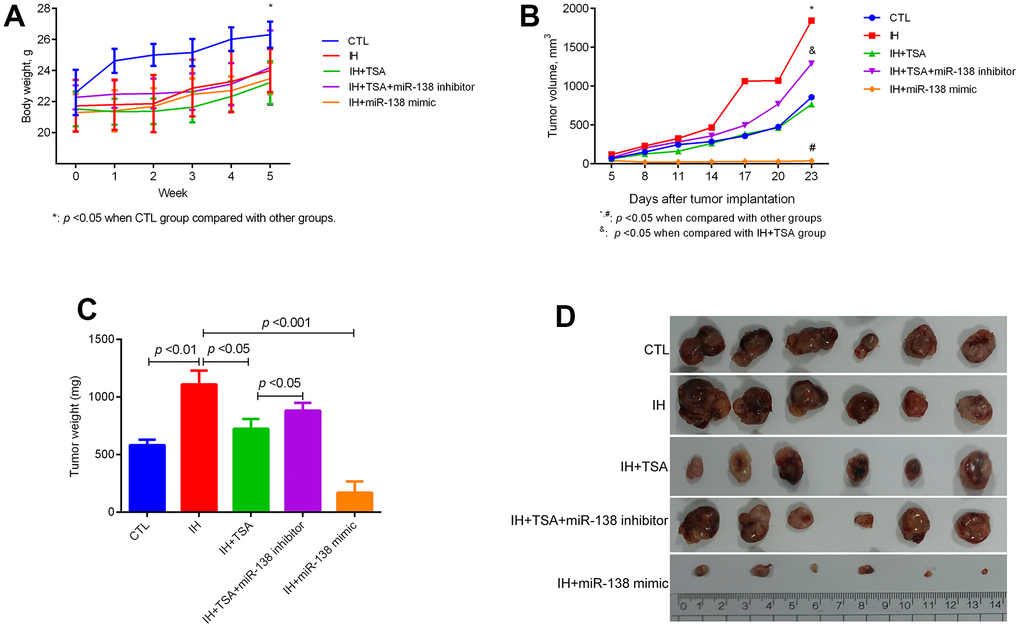
Figure 2.Effect of TSA on tumor growth in IH-exposed xenograft mice. (A) Change in body weight of mice at the indicated week. (B) Change in the tumor volume on the indicated day. (C) Comparison of tumor weight between different groups. (D) Tumor images in different groups.