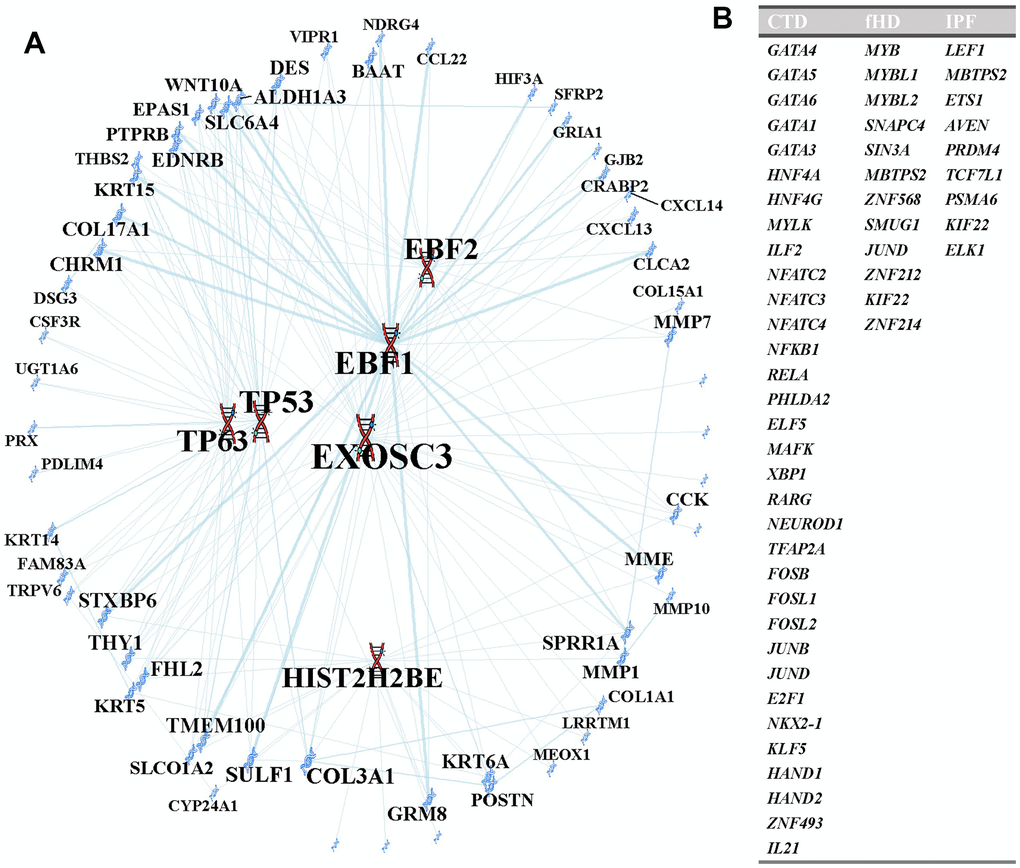
Figure 7.Transcription factors analysis. (A) TFs regulatory network. TFs were marked in red, and the DEGs were marked in blue. Meanwhile, TFs were enclosed in ovals. (B) The transcription factors in this table are unique to each pulmonary fibrosis analysis.