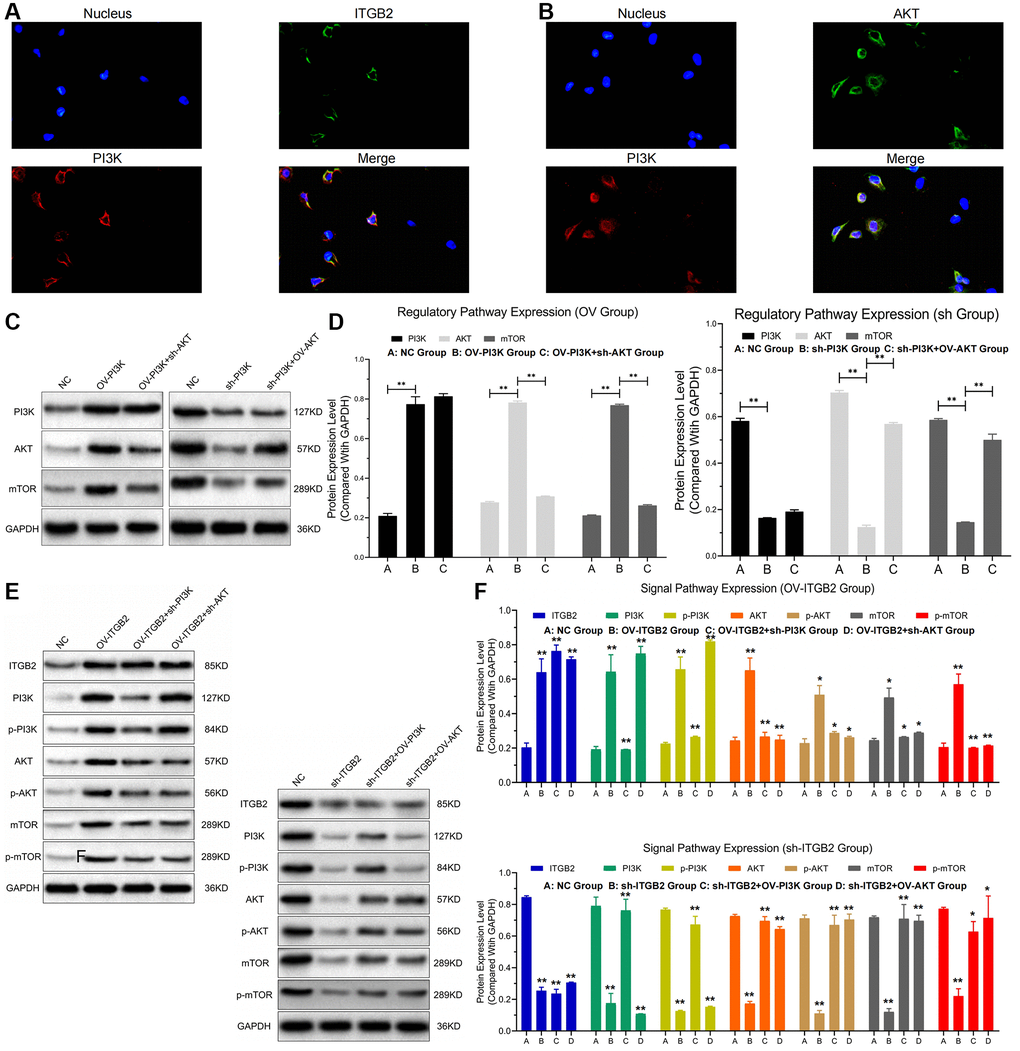
Figure 3.ITGB2 related signal pathway regulation. (A, B) FISH detection of signal pathway factors (ITGB2, AKT vs PI3K). (C, D) WB detection of ITGB2 related signal pathway expression in ovarian cancer cell models and data statistics. (E, F) WB detection of pathway factor phosphorylation expression and data statistics.