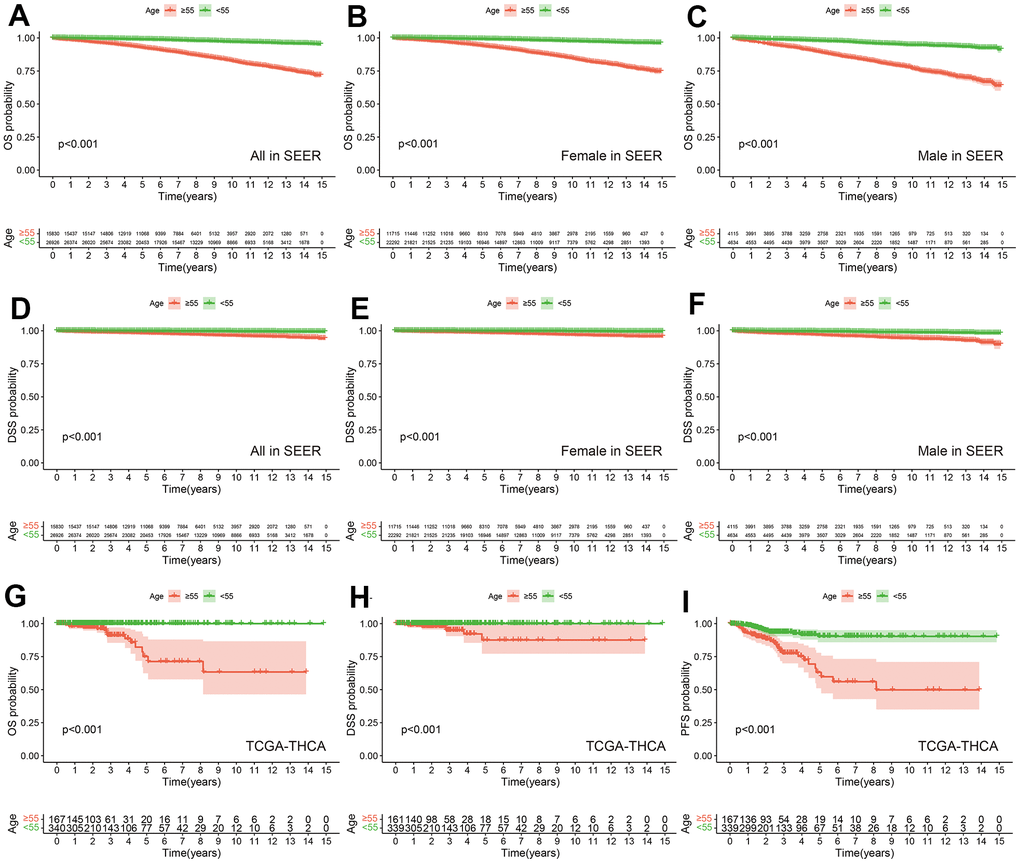
Figure 2.Prognostic differences among different age groups in SEER and TCGA-THCA cohorts. OS between PTC with Age ≥55 years and Age <55 years in all (A), female (B) and male (C) in SEER. DSS between PTC with Age ≥55 years and Age <55 years in all (D), female (E) and male (F) in SEER. OS (G), DSS (H) and PFS (I) between PTC with Age ≥55 years and Age <55 years in TCGA-THCA.