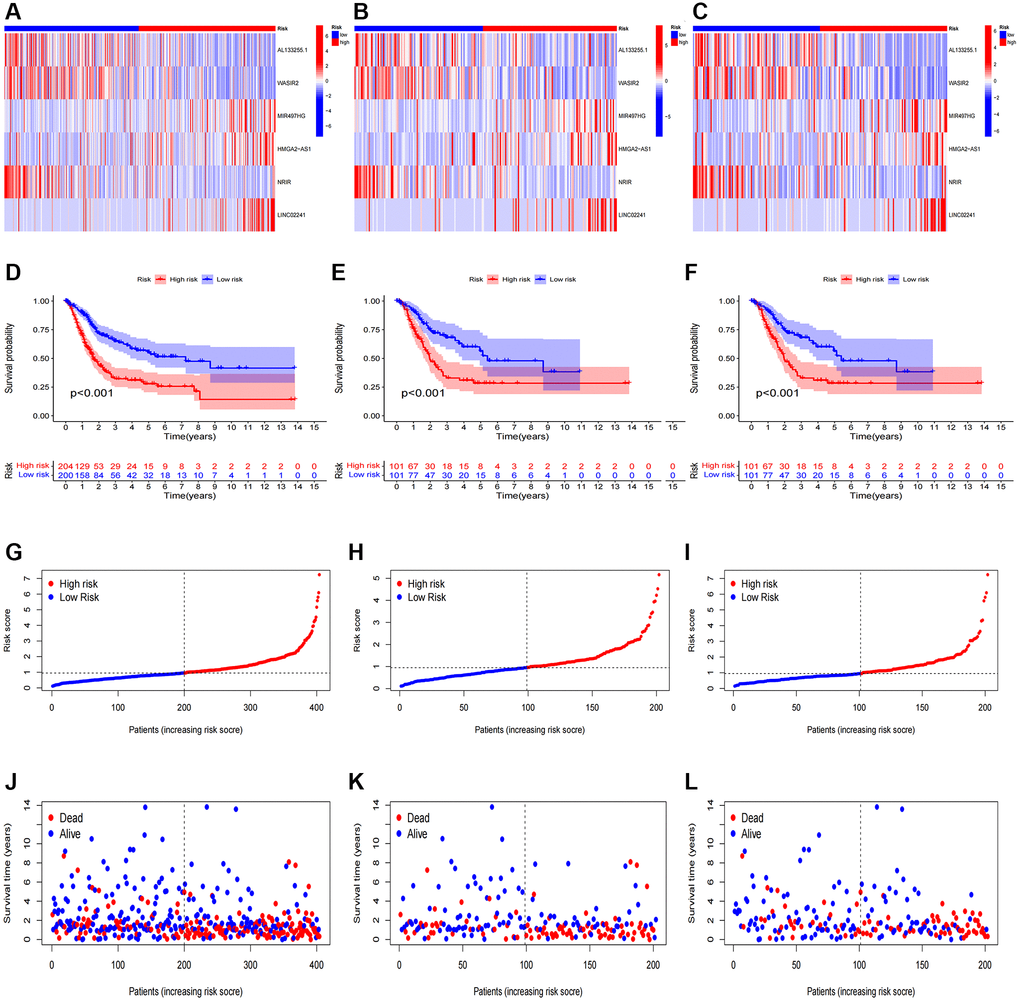
Figure 3.Prognosis evaluation and internal verification of the risk model. Heatmaps of six lncRNA expressions (A–C), risk model (D–F), survival time and survival status (G–I), and Kaplan-Meier survival curves of patients (J–L) in the entire, train, and test cohorts, respectively.