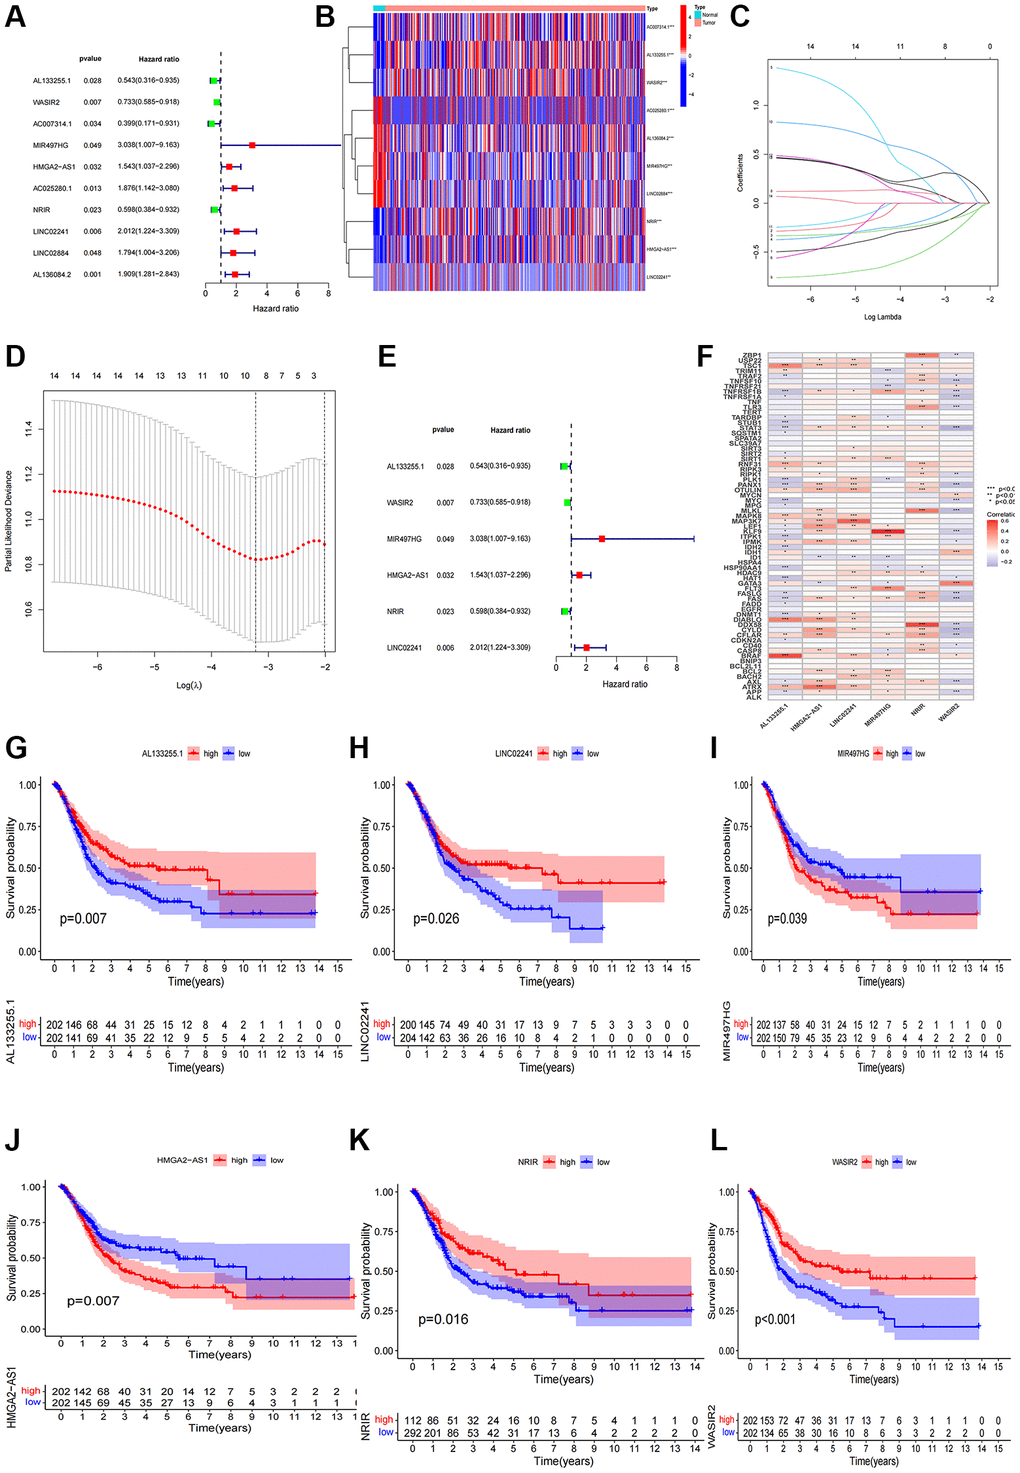
Figure 2.Construction of the NRlncRNAs risk model. (A) The forest plot of prognostic lncRNAs obtained by uni-Cox regression analysis; (B) Heatmap of 15 prognostic lncRNAs expression; (C, D) The final NRlncRNAs of the risk model was confirmed from LASSO regression analysis; (E) The forest plot of six NRlncRNAs of the risk model; (F) Correlations between NRlncRNAs of the risk model and necroptosis-related genes; (G–L) Kaplan–Meier curve of OS analyzed for the six NRlncRNA.