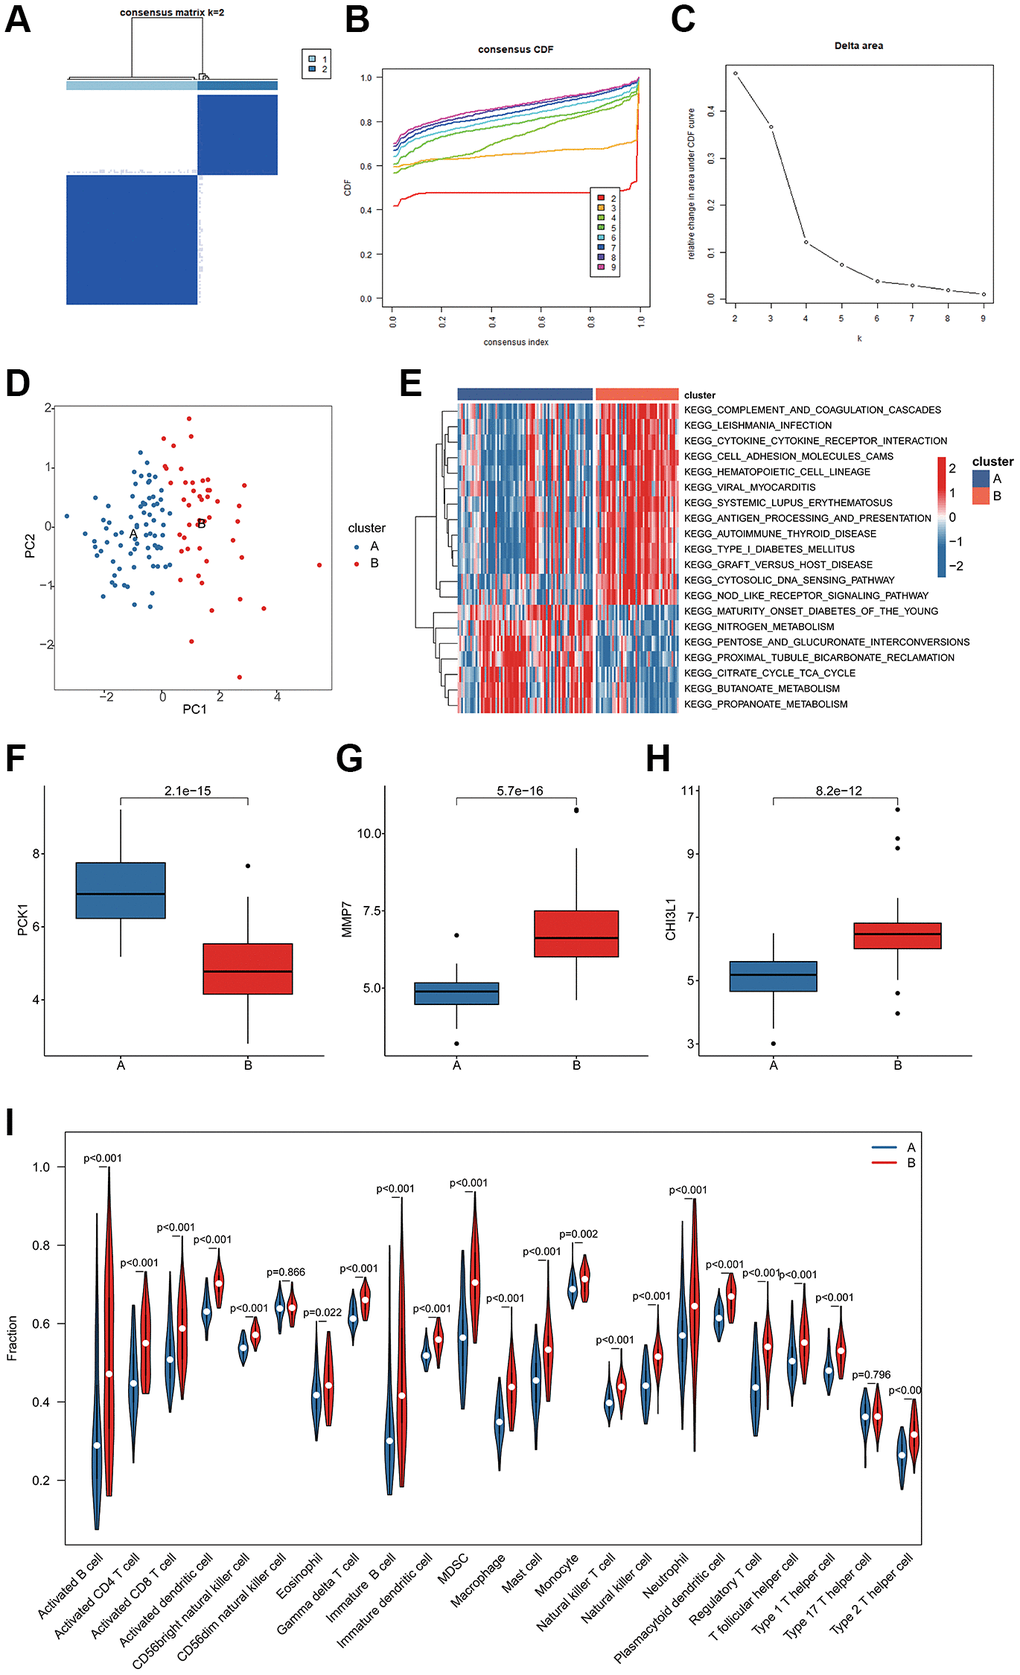
Figure 6.BRGs-based molecular subgroups identification and immune infiltration evaluation. (A–C) BRGs-based molecular subgroups generation. (D) PCA analysis of cluster A and B. (E) GSVA analysis of molecular pathways. (F–H) Expression profile of 3 BRGs related biomarkers of BRGs-based cluster subgroups. (I) Immune infiltration characterization of BRGs-based cluster subgroups.