Submit an Article
Navigate
Home
Editorial Board
Editorial Policies
Current Volume
Archive
Scientific Integrity
Publication Ethics Statements
Interviews with Outstanding Authors
Newsroom
Sponsored Conferences
Podcast
Contact
Special Collections
Submit an Article
Online ISSN: 1945-4589
Research Paper
|
Volume 16, Issue 3
|
pp. 2638–2656
Serum metabolome and gut microbiome alterations are associated with low handgrip strength in older adults
Back to article
Figure 3
(3 of 6)
−
100%
+
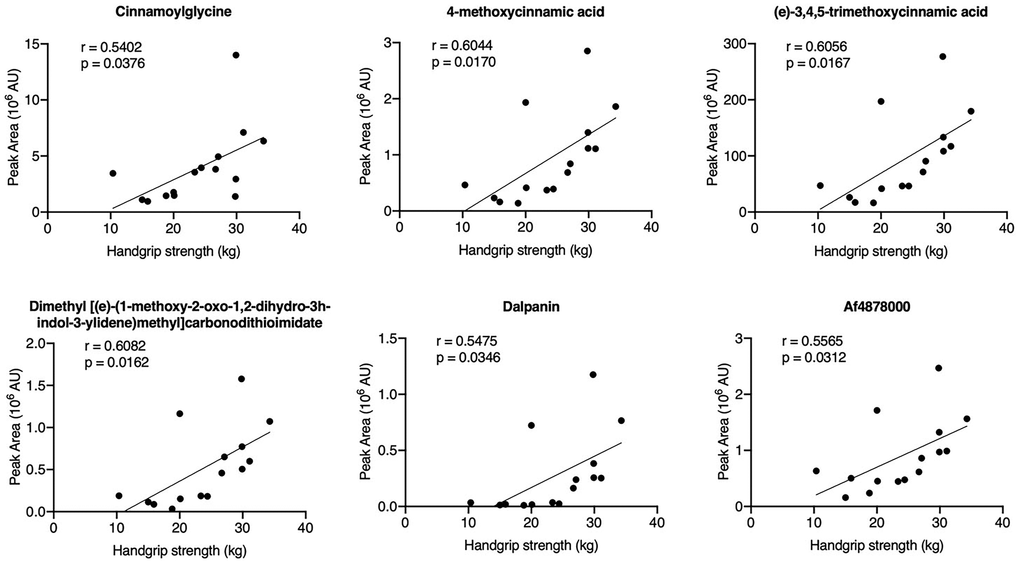
Figure 3.
Correlation analysis of the HGS values and differential metabolites in serum samples.