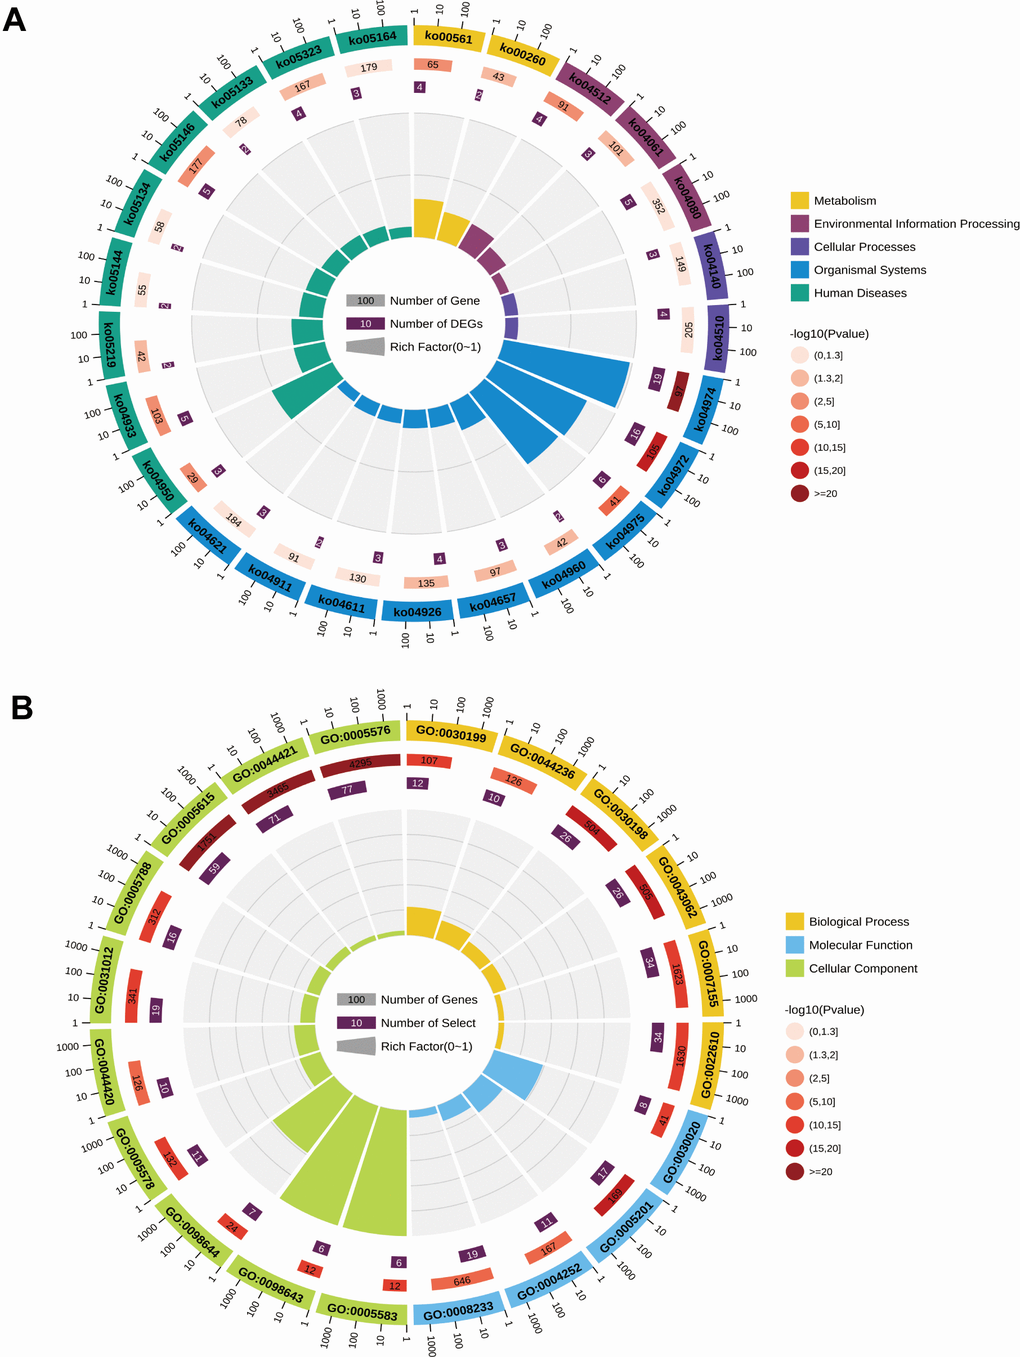
Figure 2.Circle plots of KEGG pathway analysis (A) and GO enrichment analysis (B) for differentially expressed genes in the GSE71989 dataset.
Figure 2 — A study on the role of Taxifolin in inducing apoptosis of pancreatic cancer cells: screening results using weighted gene co-expression network analysis | Aging