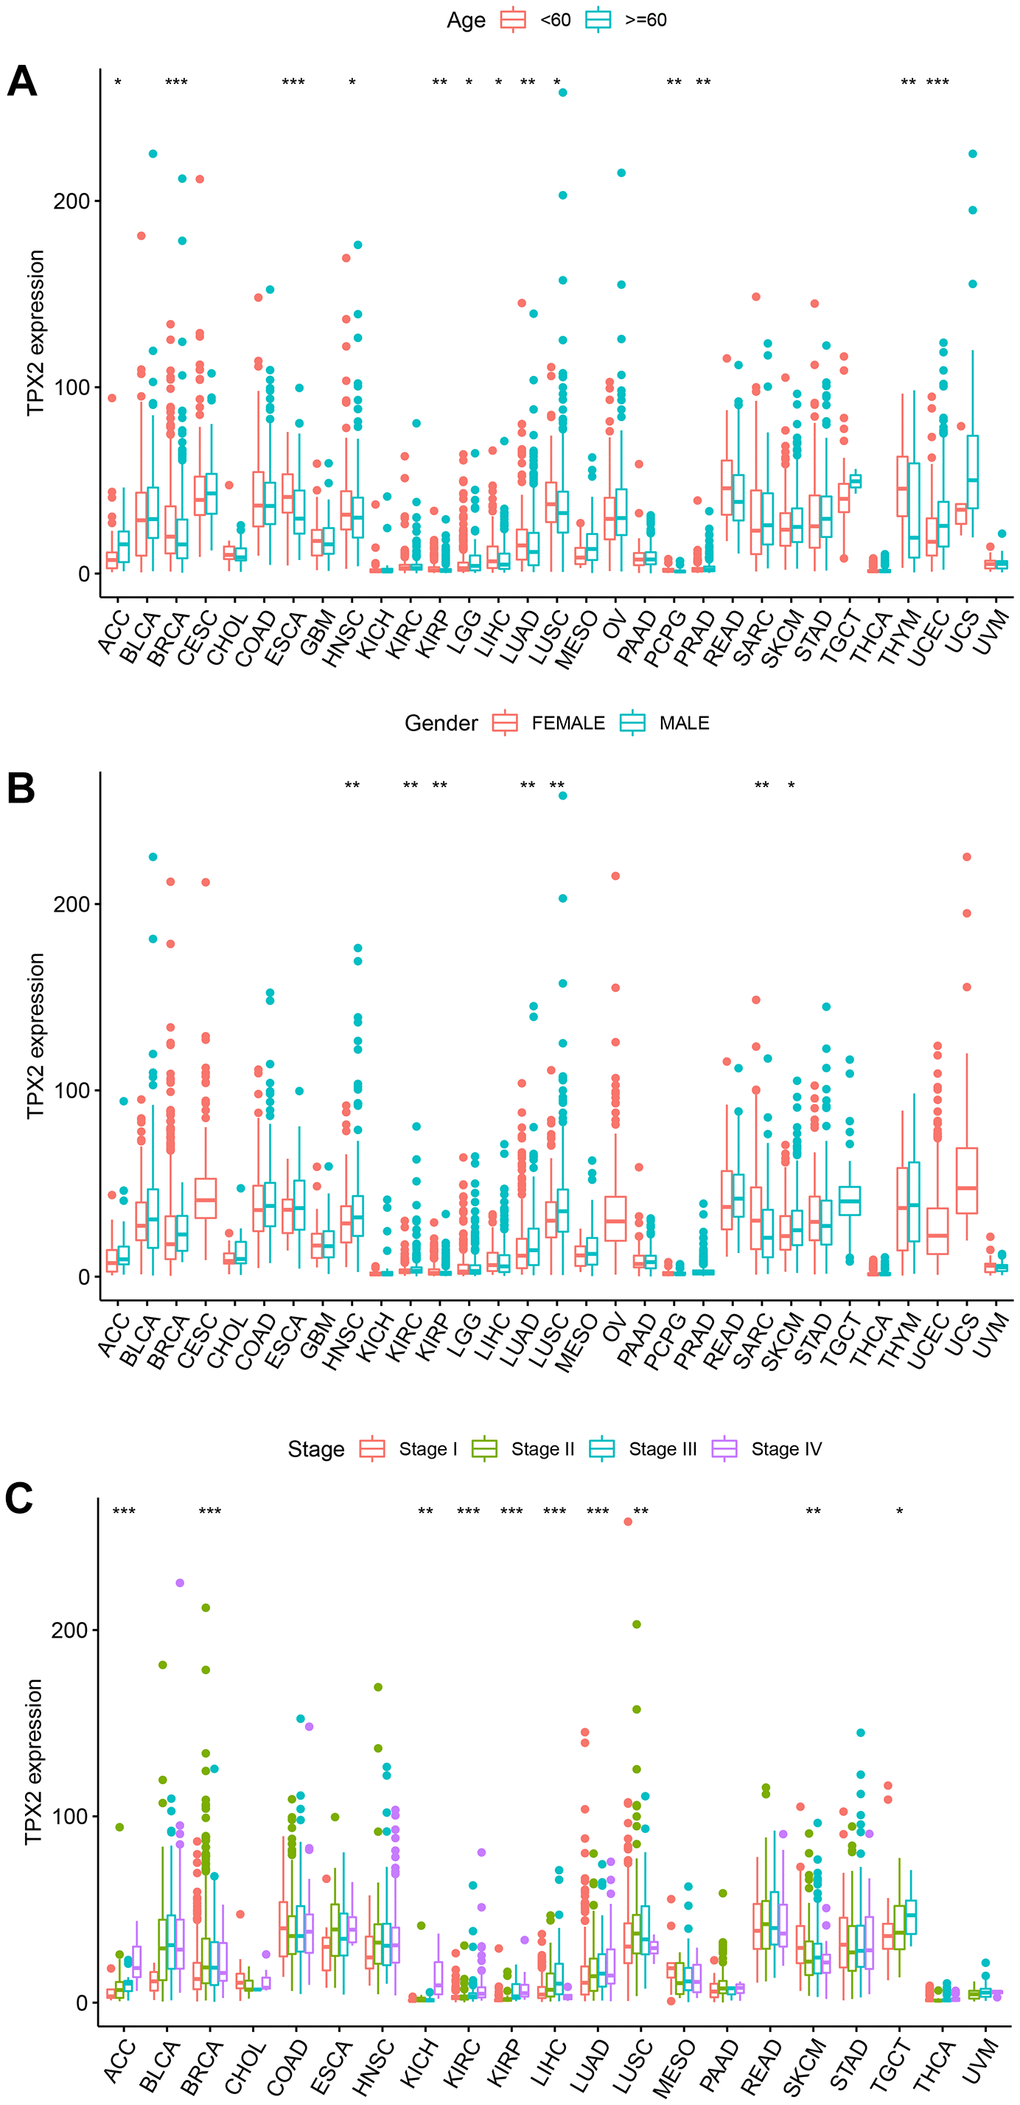
Figure 8.The relationship between TPX2 expression and clinical parameters in various cancers from TCGA database. (A) The relationship between TPX2 expression and age. (B) The relationship between TPX2 expression and gender. (C) The relationship between TPX2 expression and the pathological stages of cancers. *p< 0.05, **p< 0.01, ***p< 0.001.