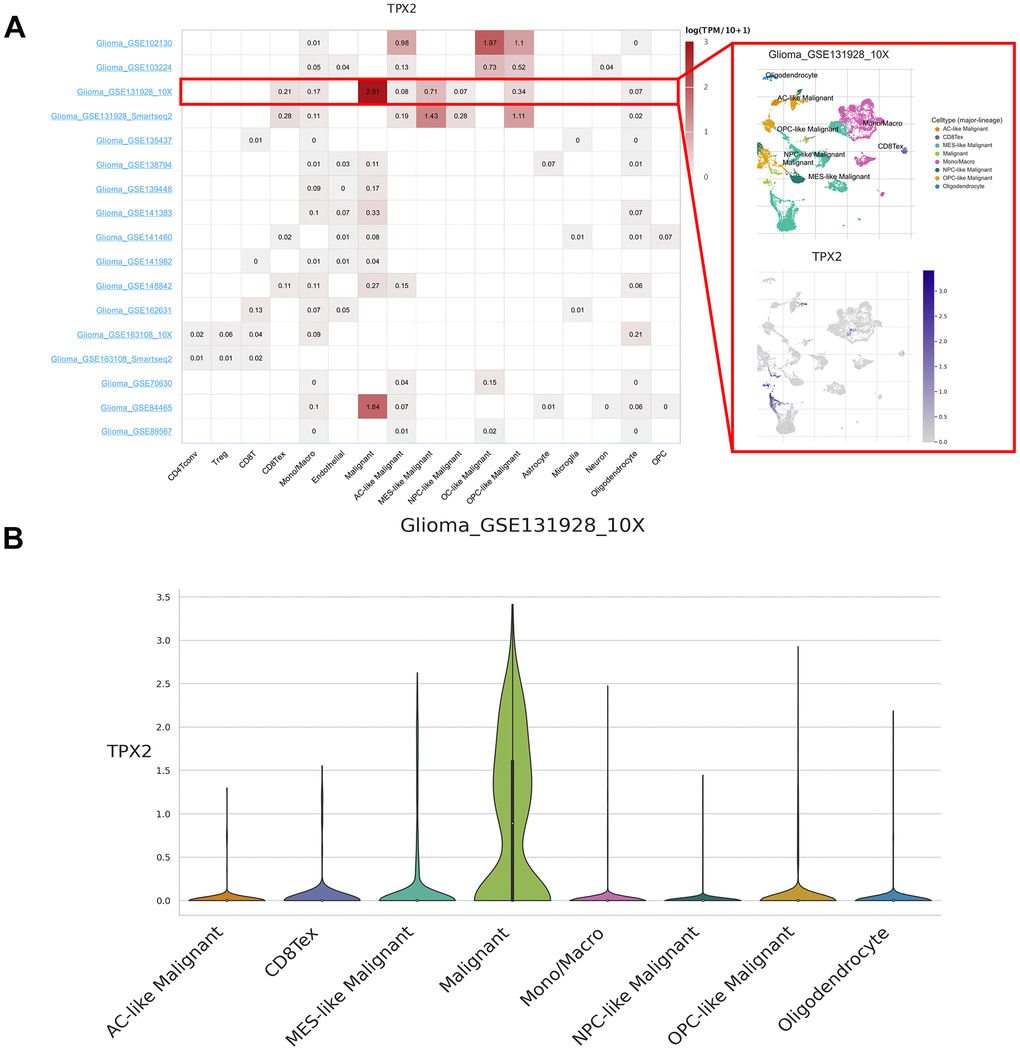
Figure 2.Single-cell expression analysis of TPX2 in glioma. (A) Heatmap of TPX2 expression in 17 glioma datasets (red rectangle: GSE131928_10× glioma dataset). (B) The violin plot showed the overexpression of TPX2 in malignant cells in GSE131928_10× glioma dataset.