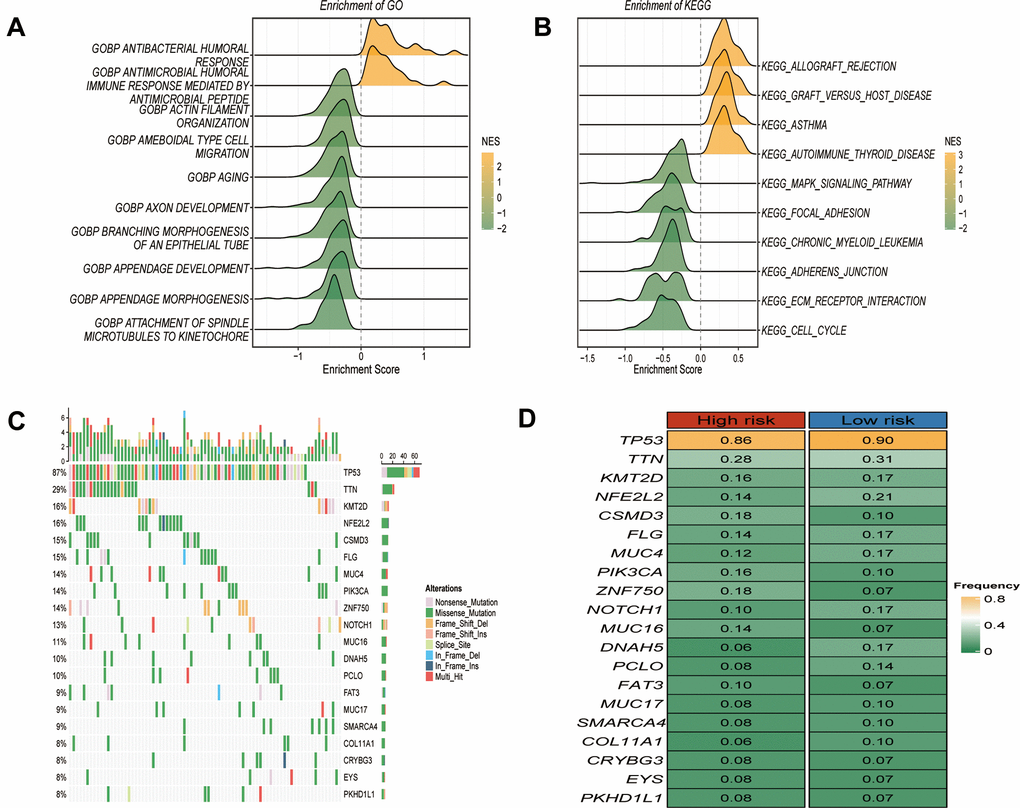
Figure 5.Functional enrichment and somatic mutations related to GRTTK patterns. (A, B) GO and KEGG enrichment analysis of differentially expressed genes between high and low risk group. (C) Waterfall plot illustrating the overall mutation landscape in ESCC. (D) Graphical representation contrasting somatic mutation frequencies between high and low risk groups.