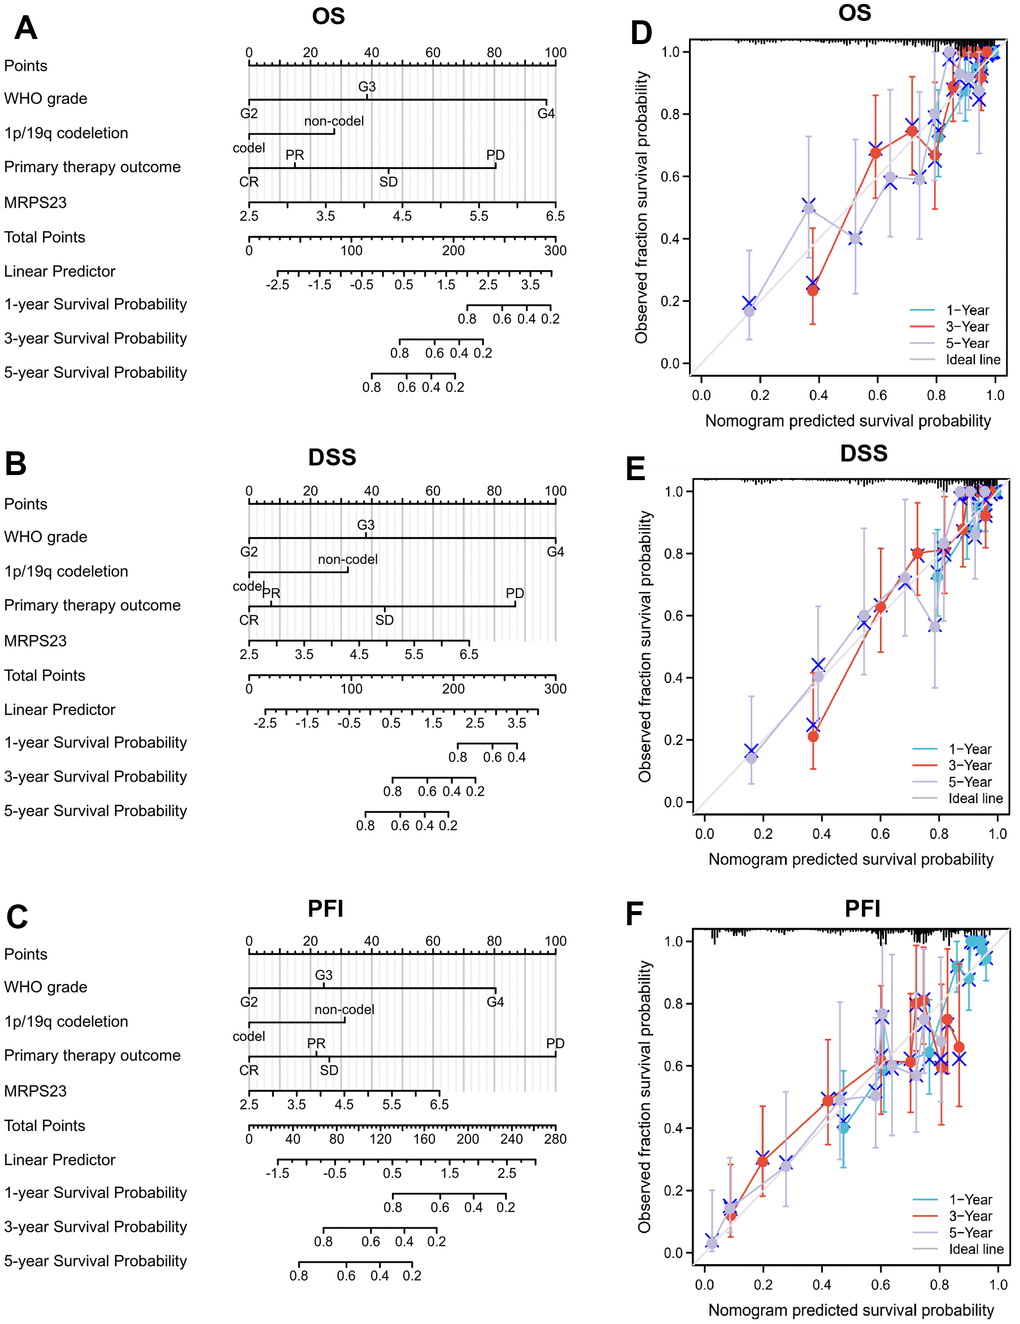
Figure 10.Nomogram and calibration curve for predicting the probability of 1-, 3-, and 5-years OS for glioma patients. (A–C) A nomogram integrates MRPS23 and other prognostic factors in glioma from TCGA data. (D–F) The calibration curve of the nomogram.