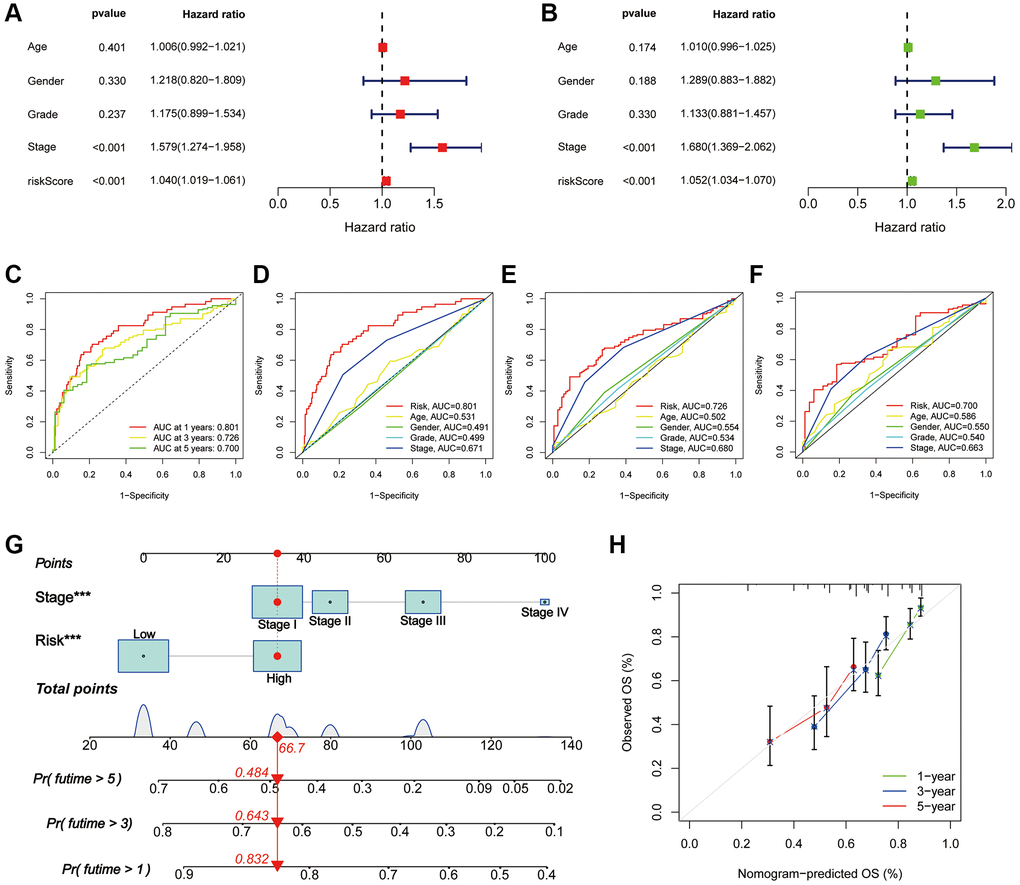
Figure 5.Assessment of the PANRI in hepatocellular carcinoma. (A, B) Risk forest plots for multivariate and univariate Cox regression. (C) ROC curves of the 1-, 3- and 5-year survival in the TCGA cohort. (D–F) Comparison of risk score ROC curves with clinicopathological parameter ROC curves. (G) Tumour stage and risk status were used to construct a nomogram for predicting patient survival. (H) Calibration curves for the nomogram. *p < 0.05, **p < 0.01 and ***p < 0.001.