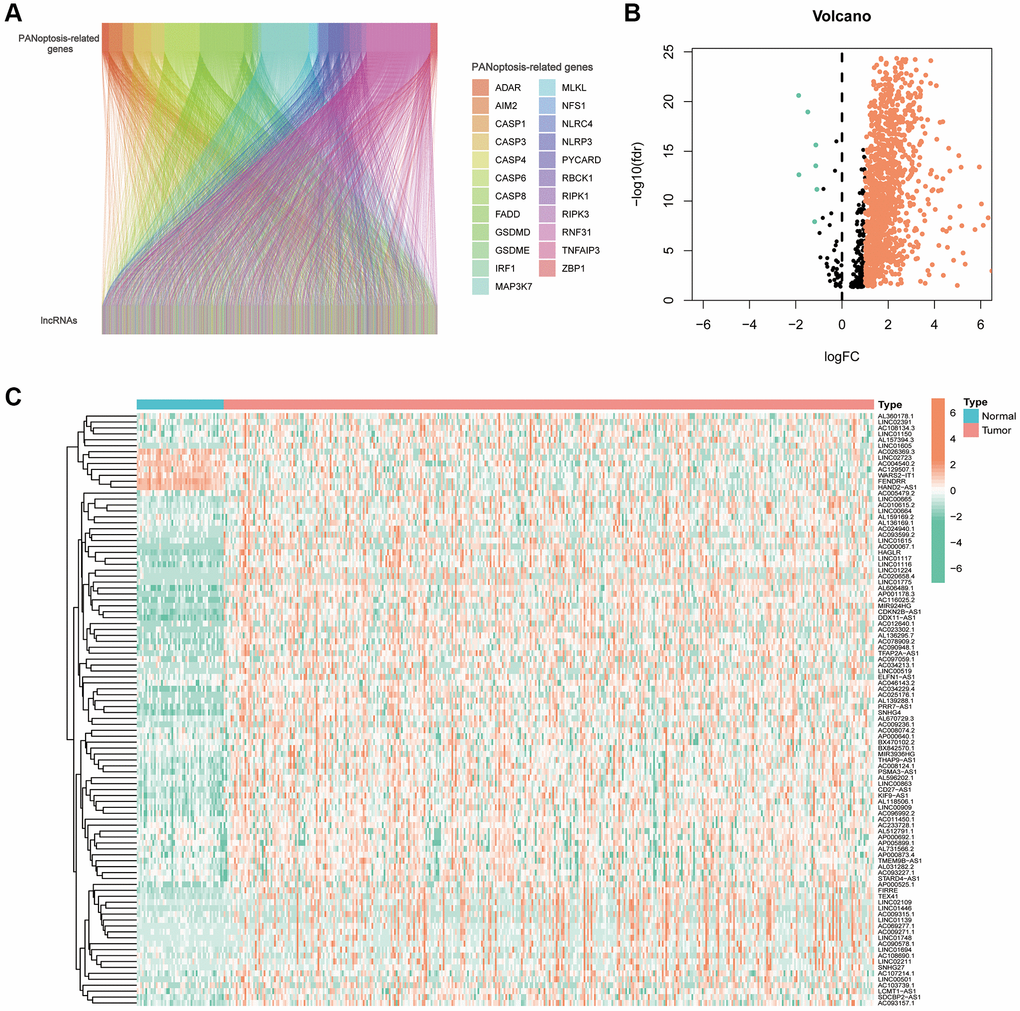
Figure 2.PANoptosis-related lncRNAs in hepatocellular carcinoma. (A) Sankey plots of the correlation between PANoptosis-related lncRNAs and PANoptosis-related genes. (B) Volcano plot showing 7 down-regulated and 1192 up-regulated expressed lncRNAs. (C) Heat map showing PANoptosis-related lncRNAs expressed in normal and tumour tissues.