Submit an Article
Navigate
Home
Editorial Board
Editorial Policies
Current Volume
Archive
Scientific Integrity
Publication Ethics Statements
Interviews with Outstanding Authors
Newsroom
Sponsored Conferences
Podcast
Contact
Special Collections
Submit an Article
Online ISSN: 1945-4589
Research Paper
|
Volume 16, Issue 3
|
pp. 2410–2437
A novel PANoptosis-related long non-coding RNA index to predict prognosis, immune microenvironment and personalised treatment in hepatocellular carcinoma
Back to article
Figure 10
(10 of 12)
−
100%
+
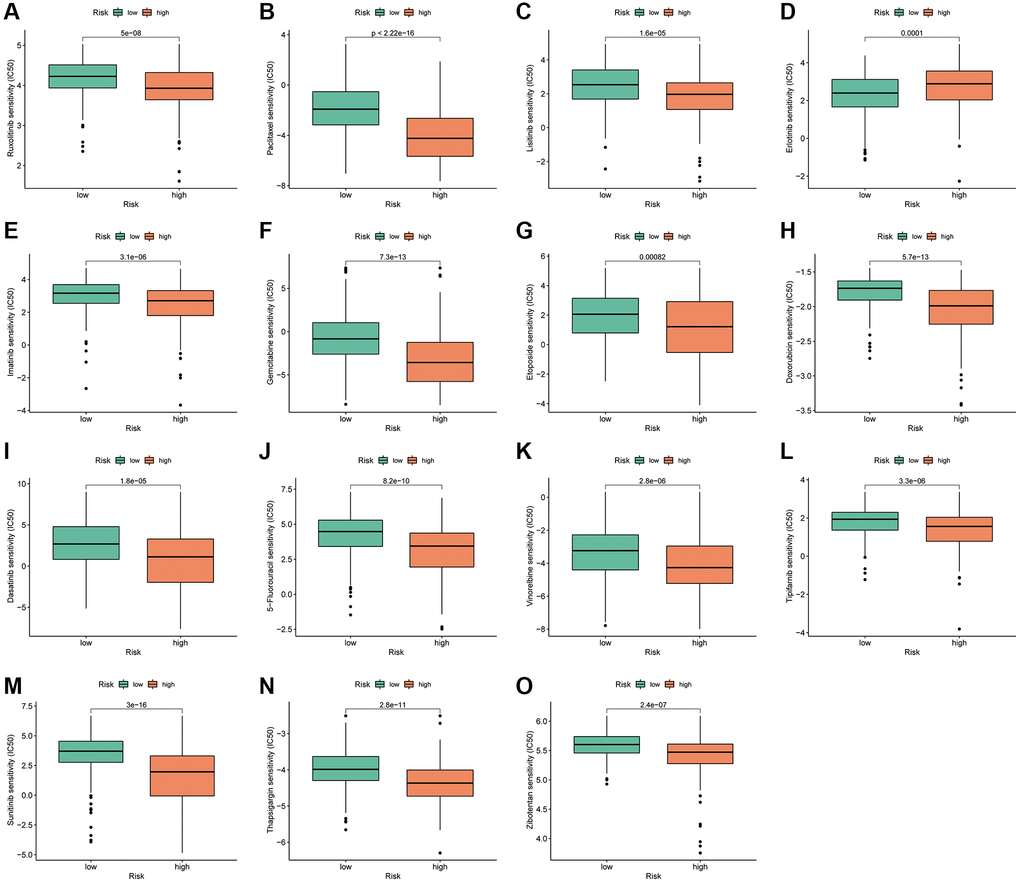
Figure 10.
PANRI-based drug sensitivity analysis.
(
A
–
O
) Box plots show that the IC50 for certain clinical therapeutics differed significantly between the two risk subgroups (
p
< 0.001).