Submit an Article
Navigate
Home
Editorial Board
Editorial Policies
Current Volume
Archive
Scientific Integrity
Publication Ethics Statements
Interviews with Outstanding Authors
Newsroom
Sponsored Conferences
Podcast
Contact
Special Collections
Submit an Article
Online ISSN: 1945-4589
Research Paper
|
Volume 16, Issue 3
|
pp. 2340–2361
5-methylcytosine RNA modification regulators-based patterns and features of immune microenvironment in acute myeloid leukemia
Back to article
Figure 12
(12 of 12)
−
100%
+
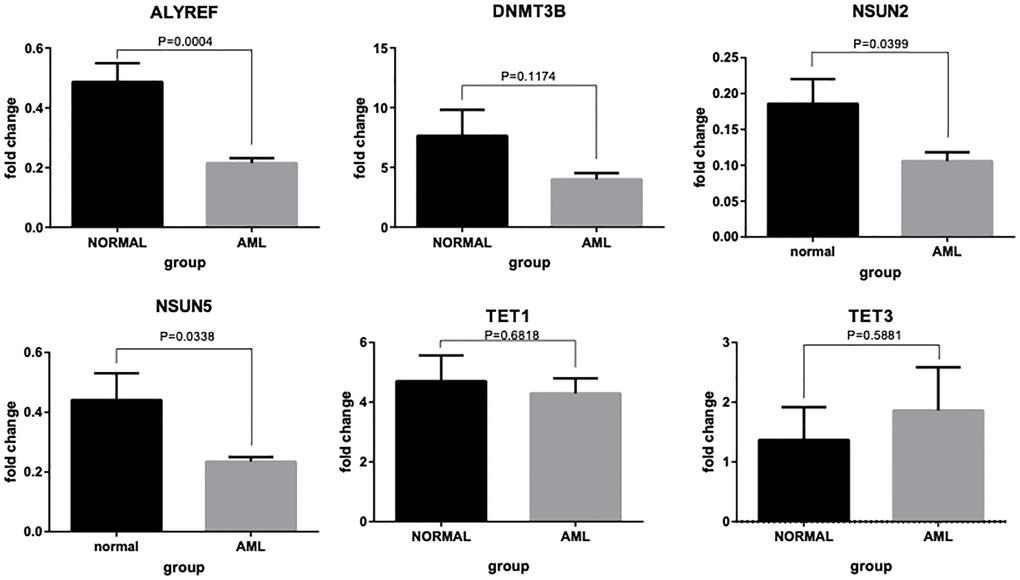
Figure 12.
RT-qPCR validation of six m5C regulator genes.
Bar plots showing differential expressions of
ALYREF
,
DNMT3B, NSUN2, NUSN5, TET1
and
TET3
between AML patients and normal controls.