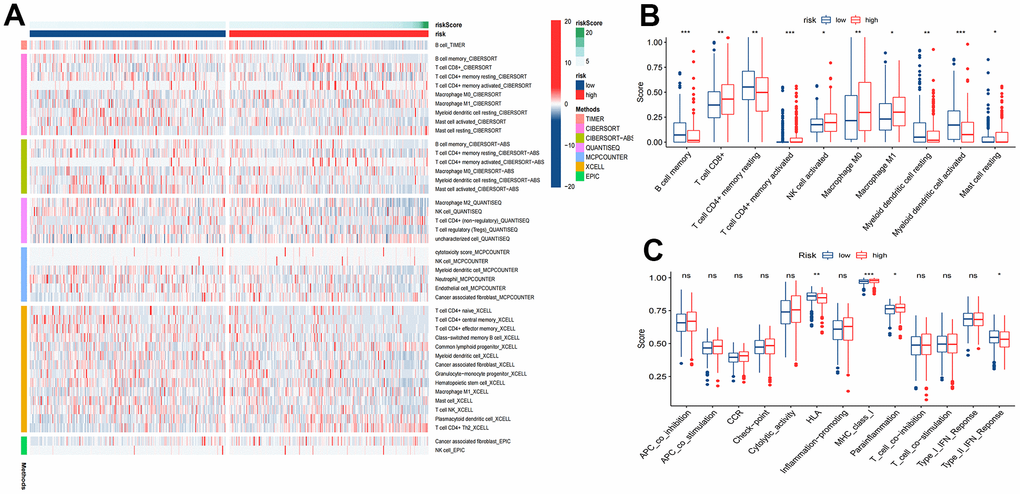
Figure 9.Tumor immune microenvironment analysis. (A) Heatmap for immune responses based on TIMER, CIBERSORT, CIBERSORT-ABS, QUANTISEQ, MCPCOUNTER, XCELL, and EPIC algorithms among high and low risk groups. (B) ssGSEA algorithm shows immune cells scores between the two risk groups. (C) ssGSEA algorithm shows immune functions scores between the two risk groups. *P<0.05; **P<0.01; ***P<0.001.