Submit an Article
Navigate
Home
Editorial Board
Editorial Policies
Current Volume
Archive
Scientific Integrity
Publication Ethics Statements
Interviews with Outstanding Authors
Newsroom
Sponsored Conferences
Podcast
Contact
Special Collections
Submit an Article
Online ISSN: 1945-4589
Research Paper
|
Volume 16, Issue 3
|
pp. 2273–2298
Prognostic value and immune landscapes of anoikis-associated lncRNAs in lung adenocarcinoma
Back to article
Figure 7
(7 of 10)
−
100%
+
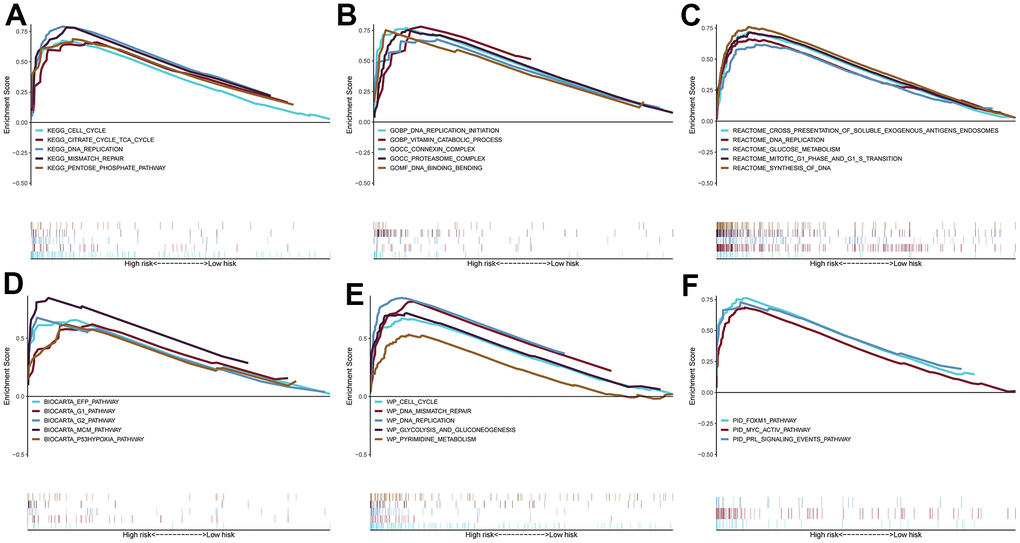
Figure 7.
Gene set enrichment analysis.
The pathways of (
A
) KEGG, (
B
) GO, (
C
) BIOCARTA, (
D
) REACTOME, (
E
) WIKIPATHWAYS, and (
F
) PID enriched in the low- and high- risk group.