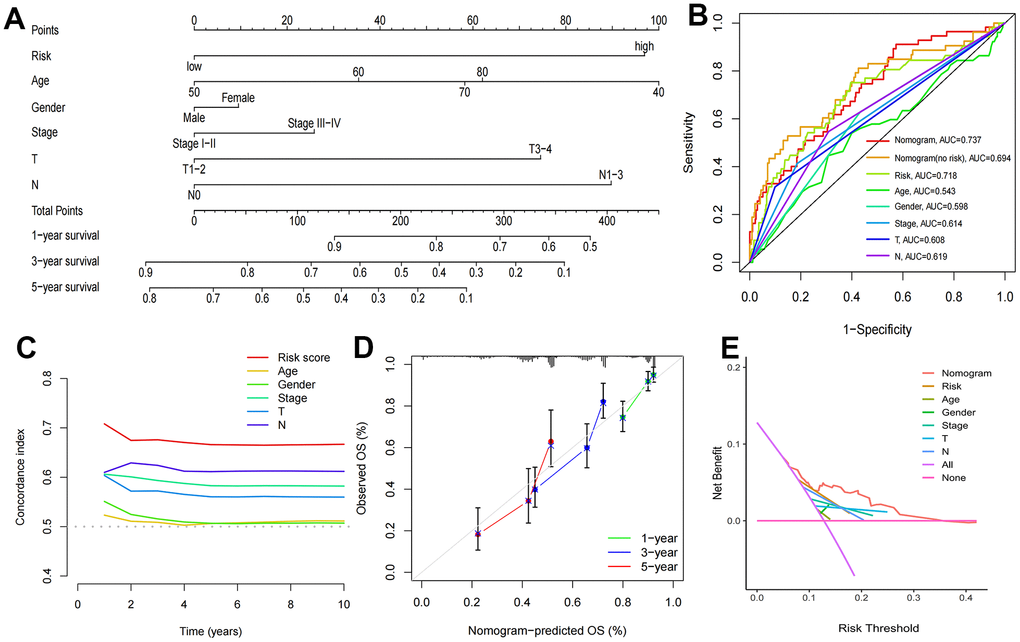
Figure 6.Construction of nomogram and validation of its predictive ability. (A) The nomogram for predicting the overall survival of patients with LUAD at 1-, 3-, and 5- years. (B) ROC curves for the risk score and other clinical characteristics to predict the overall survival rates of patients with LUAD. (C) C-Index curve for the risk score and other clinical characteristics. (D) The calibration curve for evaluating the nomogram. (E) DCA curve of the nomogram.