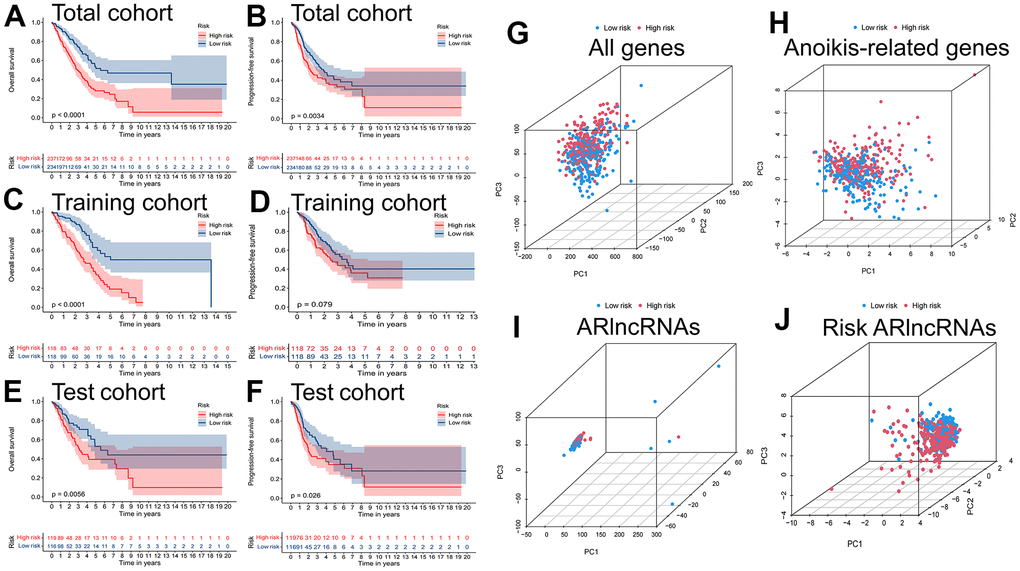
Figure 5.Survival and PCA analysis of the prognostic signature. Kaplan-Meier curves to compare the overall survival and progression-free survival of high-risk group and low-risk group in the (A, B) total, (C, D) training and (E, F) test cohort. Principal component analysis (PCA) based on (G) All genes, (H) Anoikis-related genes, (I) ARlncRNAs, and (J) Risk ARlncRNAs.