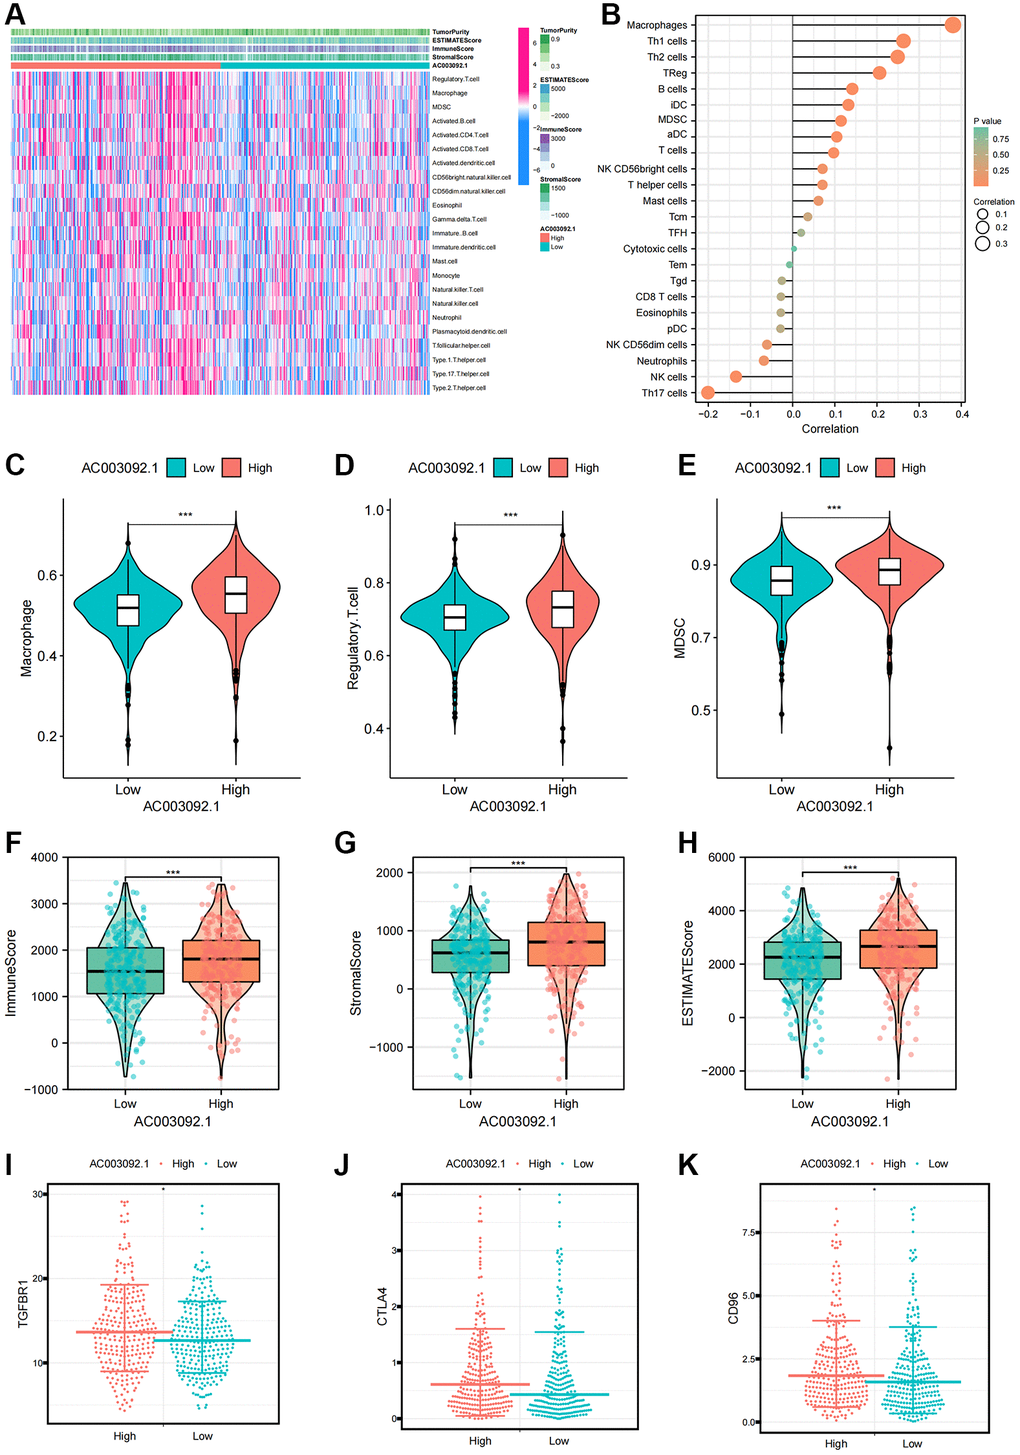
Figure 6.Immune characteristics of AC003092.1 in ccRCC. (A) Distribution of immune infiltrating cells and tumor microenvironment scores in high and low AC003092.1 expression groups; (B) Correlation between immunoinfiltrating cells and AC003092.1 expression profiles. (C–E) Differences in immunosuppressive cell expression between high and low AC003092.1 groups (C: Macrophage; D: Regulatory.T.cell; E: MDSC); (F–H) Differences in tumor microenvironment scores between high and low AC003092.1 groups (F: ImmuneScore; G: StromalScore; H: ESTIMATEScore); (I–K) Differences in immune suppression checkpoints between high and low AC003092.1 groups (I: TGFBR1; J: CTLA4; K: CD96).