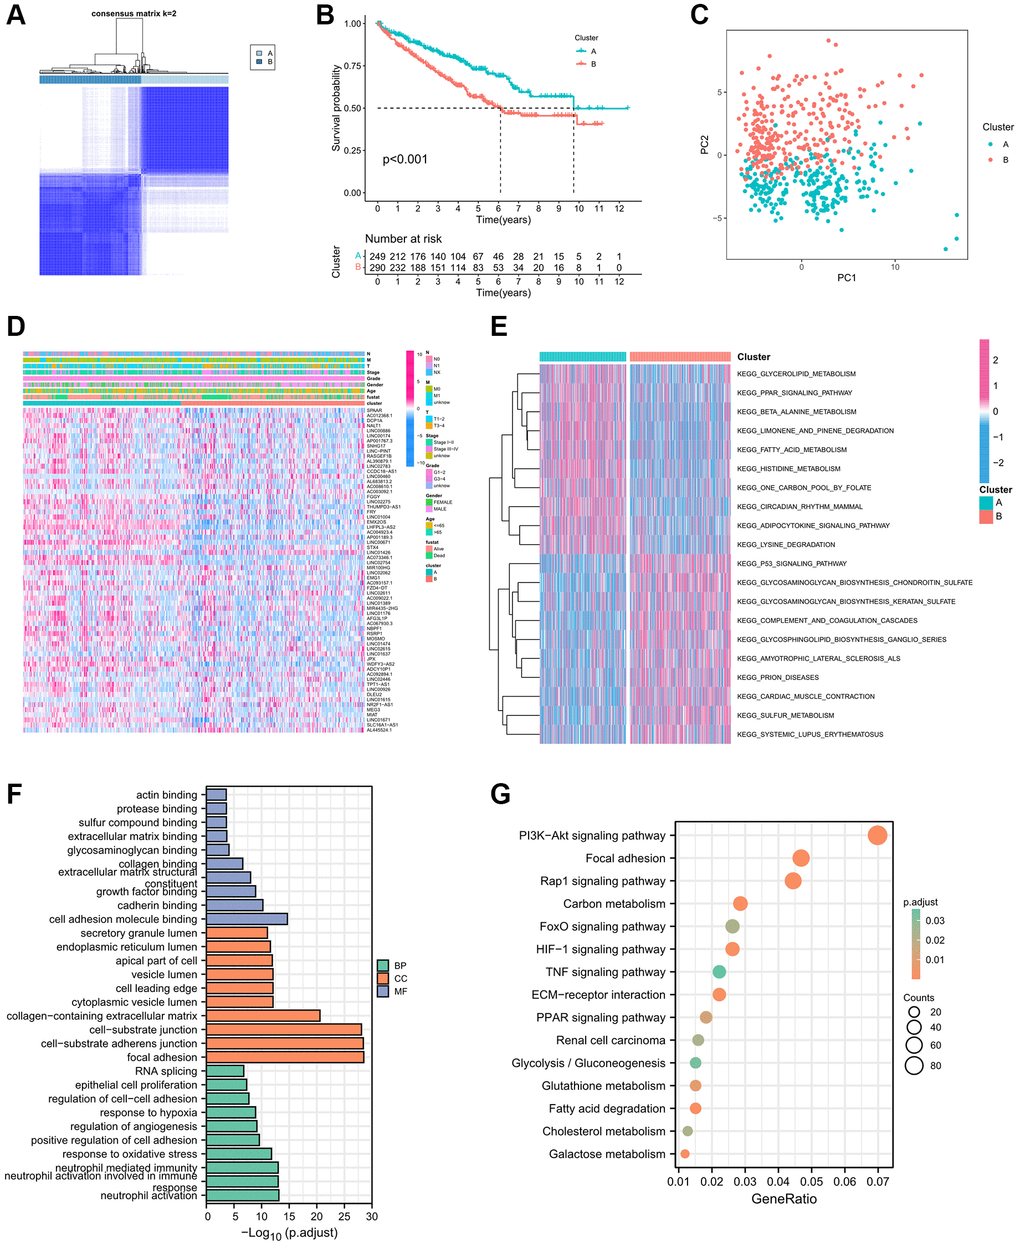
Figure 1.Establishment biological analysis of immune-related eRNAs clusters. (A) Sample distribution of 2 immune-related eRNAs clusters; (B) KM curve showing the survival differences between clusters; (C) PCA showing the trend of sample distribution between 2 clusters. (D) The heatmap presenting the distribution of immune-related eRNAs and clinical phenotype; (E) The heatmap showing the results of GSVA enrichment analysis between 2 clusters. Pink represented activated pathways; blue represented inhibited pathways. (F) GO analysis of differential genes between clusters. (G) KEGG analysis of intersection genes of differential genes between clusters.